
Figure 2. Zone 2 hepatocytes give rise to new hepatocytes during normal homeostasis.
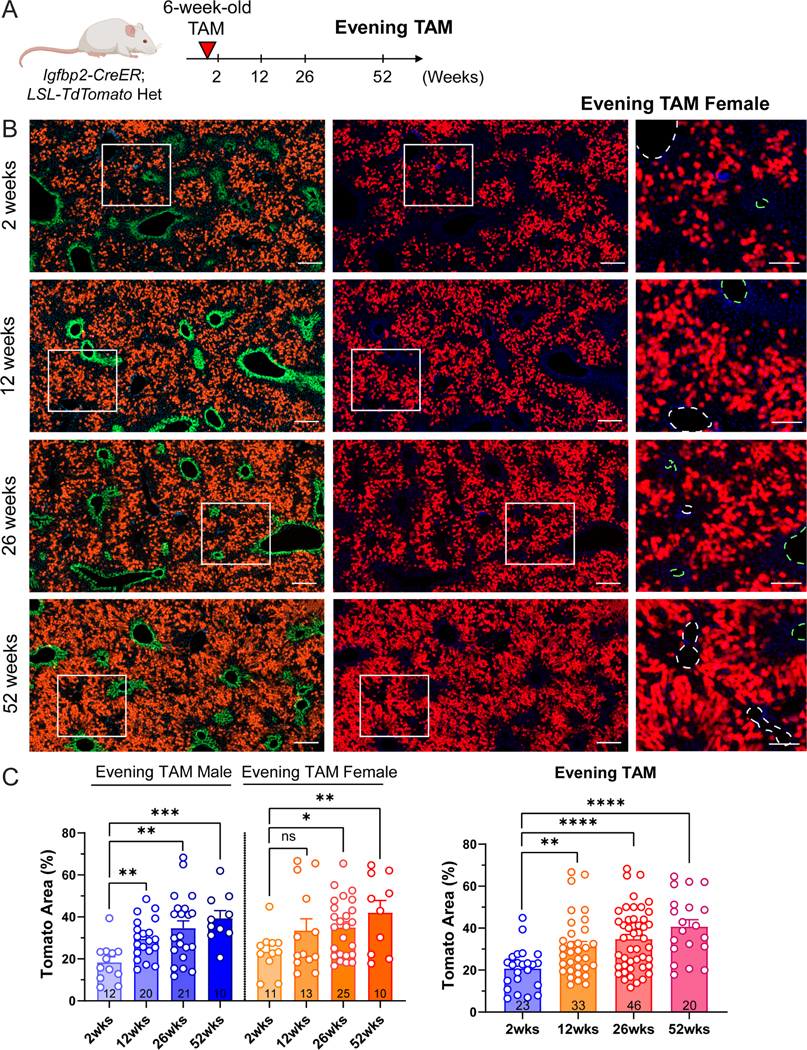
A. Schema of evening tamoxifen lineage tracing experiment under normal homeostasis.
B. Representative images of female evening tamoxifen lineage tracing over 2, 12, 26 and 52 weeks under homeostatic conditions. Scale bar = 200 μm for cropped images and 100 μm for magnified images. Slides were stained for GS (green). The green dashed circles represent CVs (marked by GS), and the white dashed circles represent PVs.
C. Quantification of the Tomato area from B. The right panel combines the data points from two sexes shown in the left panel. The 2-week data points are the same as the evening timepoints in Figure 1E (n = 23, 33, 46 and 20 mice for 2, 12, 26 and 52 weeks).
All data in this figure are presented as mean ± SEM. Significance is displayed as p < 0.05 (*), p < 0.01 (**), p < 0.001(***), and p < 0.0001 (****).