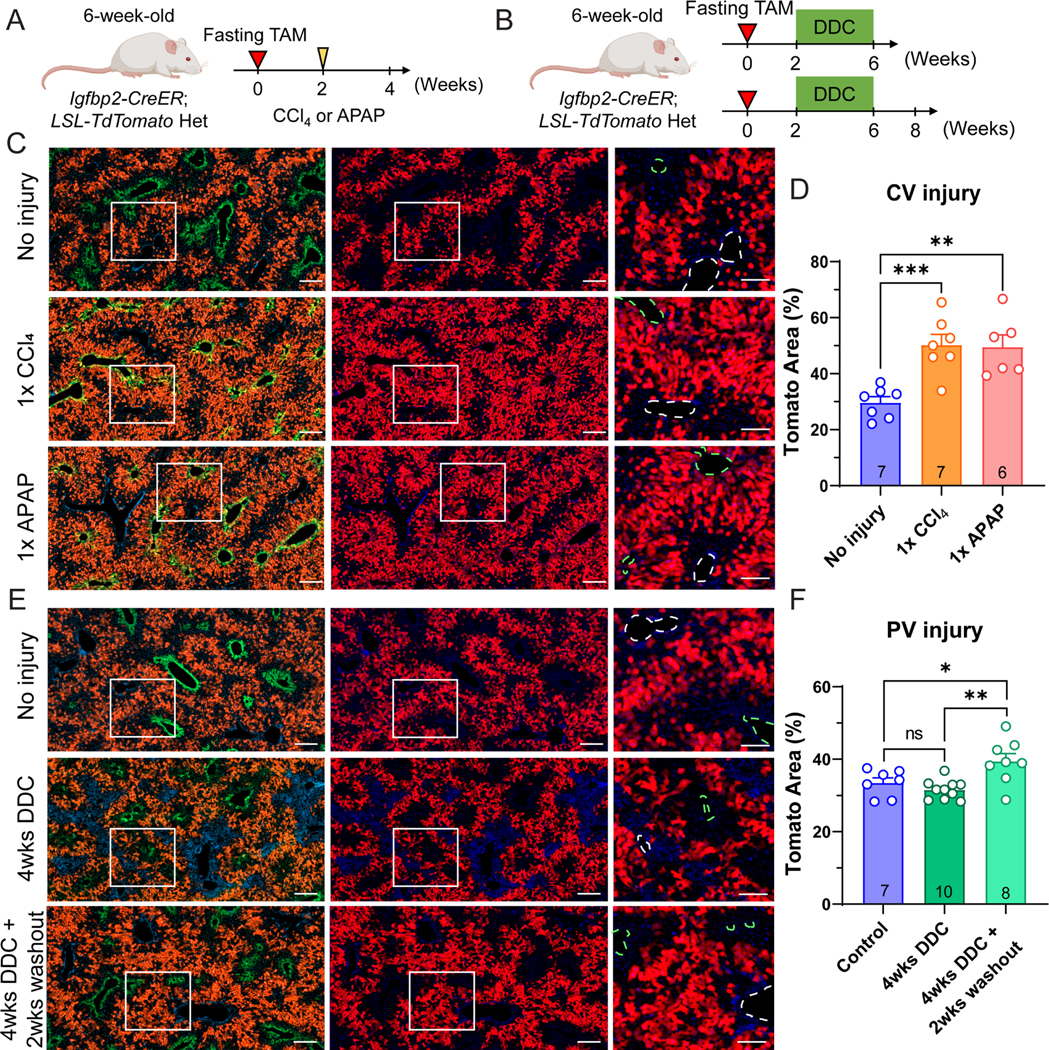
Figure 3. IGFBP2+ zone 2 cells regenerate after both pericentral and periportal injuries.

A. Schema of fasting tamoxifen males challenged with CCl4 or APAP.
B. Schema of fasting tamoxifen males given 4 weeks of DDC diet.
C. Representative images of fasting tamoxifen treated males without injury or two weeks after CCl4 or APAP injury. Scale bar = 200 μm for cropped images and 100 μm for magnified images. Slides were stained for GS (green). The green dashed circles represent CVs (marked by GS), and the white dashed circles represent PVs.
D. Quantification of the Tomato area from C (n = 7, 7 and 6 mice for no injury, CCl4 and APAP, respectively).
E. Representative images of fasting tamoxifen male without injury, after 4 weeks of DDC feeding, or after 4 weeks DDC plus a 2 week washout period with normal chow. Scale bar = 200 μm for cropped images and 100 μm for magnified images. Slides were stained for GS (green). The green dashed circles represent CVs (marked by GS), and white dashed circles represent PVs.
F. Quantification of the Tomato area from E (n = 7, 10, and 8 mice for control diet, 4 weeks of DDC, and 4 weeks of DDC + 2 weeks of washout).
All data in this figure are presented as mean ± SEM. Significance is displayed as p < 0.05 (*), p < 0.01 (**), p < 0.001(***), and p < 0.0001 (****).
