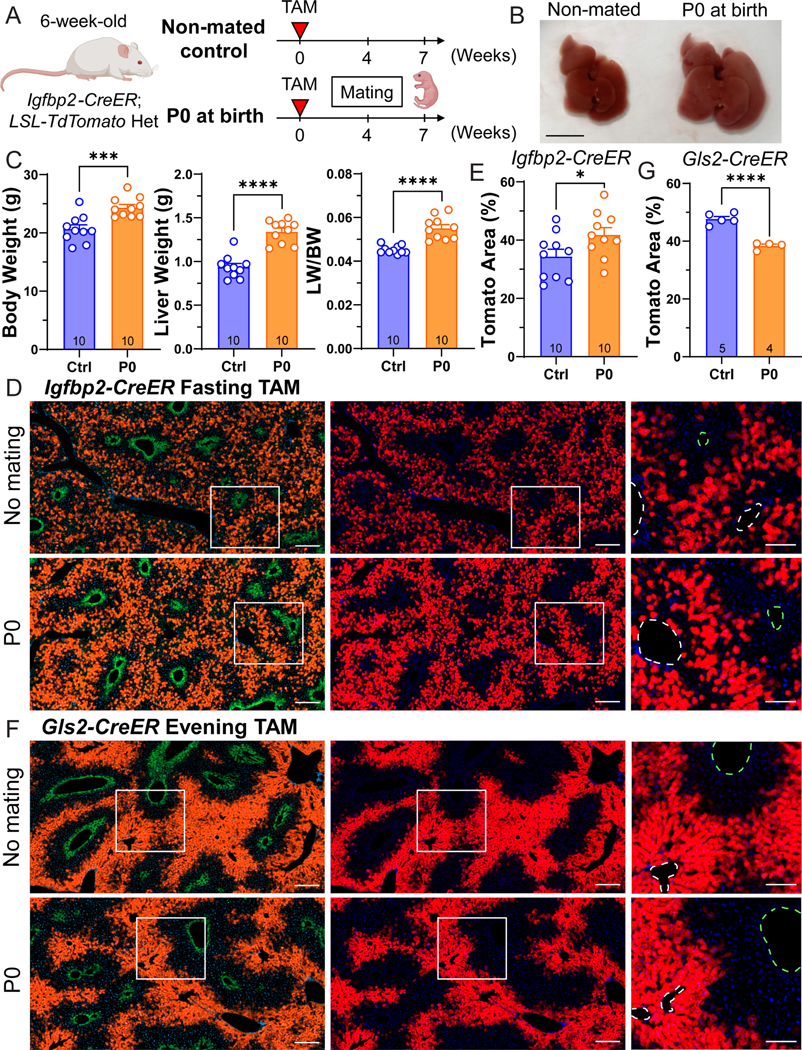
Figure 5. Zone 2 cells contribute to liver expansion during pregnancy.

A. Schema of the pregnancy lineage tracing experiment. Igfbp2-CreER mice were given tamoxifen at 6 weeks of age, and mated 4 weeks afterwards. The livers were harvested when the pups were born (P0) in the pregnancy group.
B. Gross images of livers from control and pregnant mice. Scale bar, 1 cm.
C. Body weight, liver weight, and liver-to-body weight ratios of non-mated controls (Ctrl) and the pregnant group collected at P0 (n = 10 and 10 for control and pregnant mice).
D. Representative images of control and pregnant livers from Igfbp2-CreER mice. Scale bar = 200 μm for cropped images and 100 μm for magnified images. Slides were stained for GS (green). The green dashed circles represent CVs (marked by GS), and the white dashed circles represent PVs.
E. Quantification of the Tomato area from D (n = 10 and 10 for control and pregnant mice).
F. Representative images of control and pregnant livers from Gls2-CreER mice. Scale bar = 200 μm for cropped images and 100 μm for magnified images. Slides were stained for GS (green). The green dashed circles represent CVs (marked by GS), and the white dashed circles represent PVs.
G. Quantification of the Tomato area from F (n = 5 control and 4 pregnant mice).
All data in this figure are presented as mean ± SEM. Significance is displayed as p < 0.05 (*), p < 0.01 (**), p < 0.001(***), and p < 0.0001 (****).
