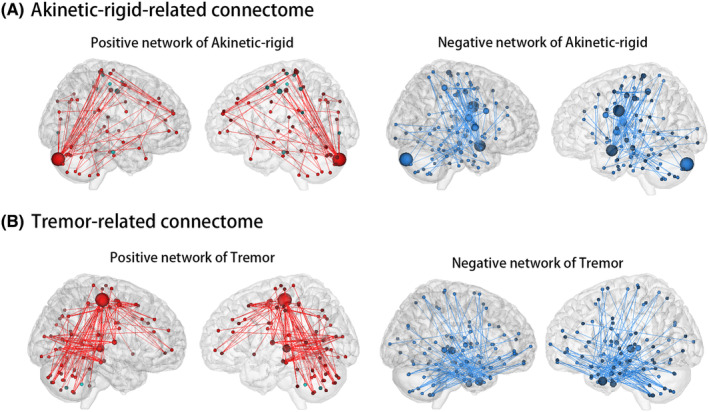
FIGURE 3.

Connection patterns of Akinetic‐rigid‐related connectome (A) and tremor‐related connectome (B). Negative connections were represented by the blue line and positive connections by the red line. Nodes were sized according to the number of connections they contain. A larger node contained more connections.
