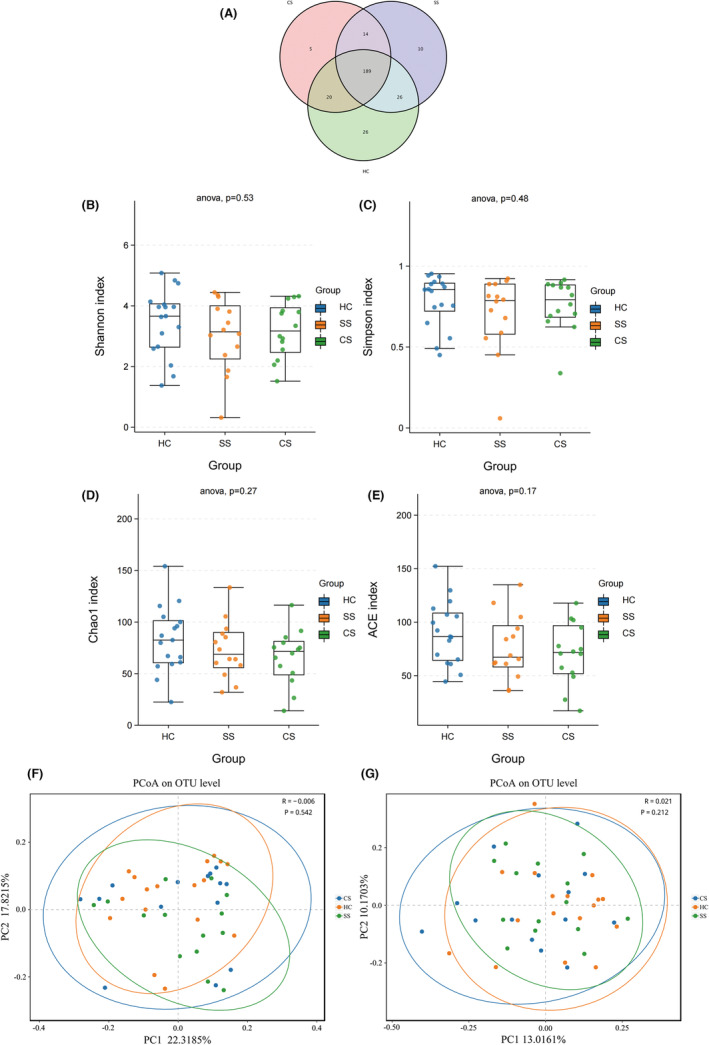
FIGURE 1.

The Venn diagram showed the number of common and unique characteristic OTUs among the three groups of samples, and intuitively showed the coincidence of the characteristics between the samples (A). Alpha diversity analysis showed that there was no statistical difference in species abundance and diversity among the three groups. Shannon and Simpson indexes showed no significant difference in species diversity among healthy control, subacute stroke and convalescent stroke groups (B, C); Chao1 and ACE indexes showed that there was no significant difference in species abundance among the three groups (D, E). PCoA proved that there was no significant difference in the Beta diversity of the gut microbiota between the three groups, according to the Weighted Unifrac distance algorithm (F) and the Unweighted Unifrac distance algorithm (G). PCoA, principal coordinates analysis.
