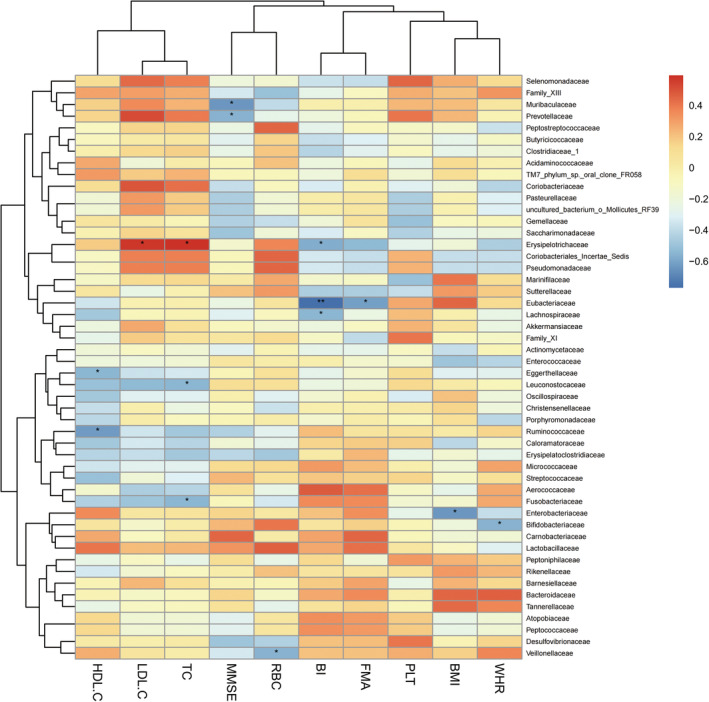
FIGURE 4.

Heatmap of spearman rank correlation analysis between gut microbiota and clinical indexes in convalescent stroke group at family level. Red means positive correlation and blue means negative correlation. *P < 0.05, **P < 0.01, ***P < 0.001.
