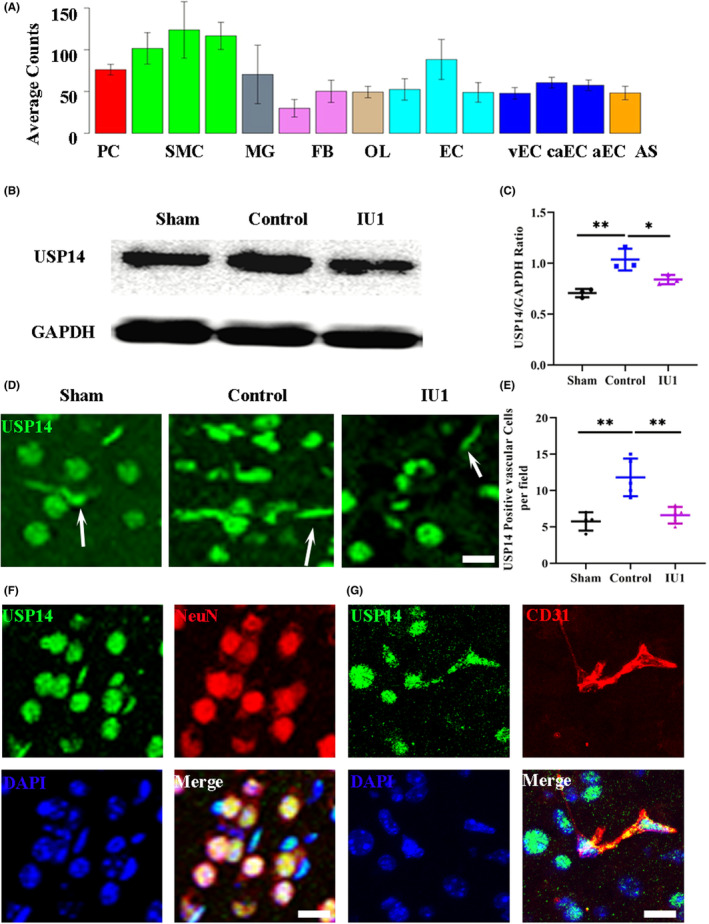
FIGURE 1.

USP14 expression in the normal and ischemic brain. (A) Histogram showing the USP14 read counts from single‐cell sequencing of the brain. aEC, artery endothelial cells; AS, astrocytes; caEC, capillary endothelial cells; EC, endothelial cells; FG, fibroblasts; MG, microglial cells; OL, oligodendrocytes; PC, pericytes; SMC, smooth muscle cells; vEC, vein endothelial cells. (B) Western blot results showing USP14 expression in the brains of sham mice, ischemia model mice, and IU1‐treated ischemia model mice. (C) Quantification of the Western blot data. Note the increase in USP14 expression after MCAO and decrease in USP14 expression after IU1 treatment. n = 3 in each group; **p < 0.01, *p < 0.05. (D) Confocal images of immunostaining for USP14 expression in each group. The arrowheads indicate vascular‐like USP14‐positive cells; bar = 20 μm. (E) Quantification of USP14‐positive vascular cells; **p < 0.01 using one‐way ANOVA followed by Bonferroni's post hoc test; n = 4–5 in each group. (F) Double immunostaining showing that USP14 (green) colocalized with NeuN (red). (G) Typical confocal images showing that USP14 (green) was expressed on CD31‐positive endothelial cells (red). Bar = 20 μm.
