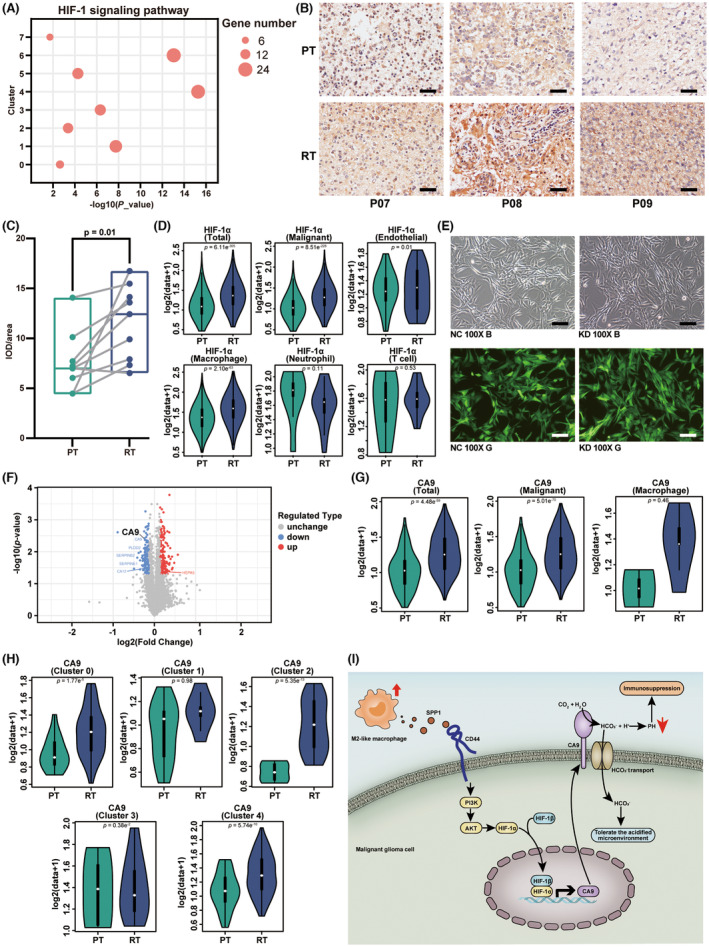
FIGURE 6.

HIF‐1α/CA9 pathway upregulated in the recurrent malignant glioma. (A) Bubble plot showing enrichment of the HIF‐1 signaling pathway in 8 subgroups of malignant cells. (B) IHC staining of HIF‐1α antibody, showing the expression of HIF‐1α in paired PT and RT malignant glioma tissue. Scale bar, 10 μm. (C) Boxplot illustrating the expression of HIF‐1α in 9 matched PT and RT pairs. The p‐value was calculated by Student's t‐test. (D) Violin plot showing the HIF‐1α level of different cell types in PT and RT samples. The p‐value was calculated by Student's t‐test. (E) The microscopy image of U‐87 cell line after transfection using lentivirus. Magnification: 100×. NC: negative control. KD: knock down. B and G represent the bright field and green fluorescent field, respectively. Scale bar, 10 μm. (F) Volcano plot shows the differentially expressed genes in the KD group, compared with the NC group. Names of the most significant genes are indicated in the plot. (G) Violin plot showing the CA9 level of different cell types in the PT and RT samples. The p‐value was calculated by Student's t‐test. (H) Violin plot showing the CA9 level of each malignant cell subgroup in the PT and RT samples. The p‐value was calculated by Student's t‐test. (I) Schematic diagram of the intercellular interaction between M2‐like TAMs and malignant glioma cells in recurrent malignant glioma.
