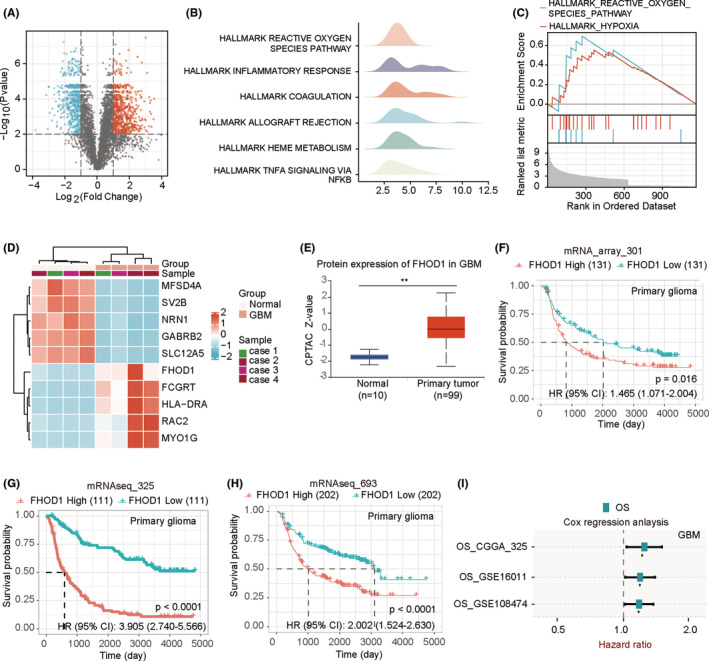
FIGURE 1.

Identification of up‐regulated FHOD1 expression in glioma tissues. (A) Volcanic maps suggested the up‐regulated and down‐regulated molecules in glioma tissues. (B, C) GSEA analysis indicated the significant pathways regulated by the differentially expressed molecules. (D) Heat map of the top 10 altered molecules. (E) The CPTAC database confirmed up‐regulated FHOD1 in glioma tissues. (F–H) In three CGGA datasets, the glioma patients with low FHOD1 expression displayed favorable prognosis. (I) The glioma patients with high FHOD1 expression displayed high risk of recurrence.
