
FIGURE 4.
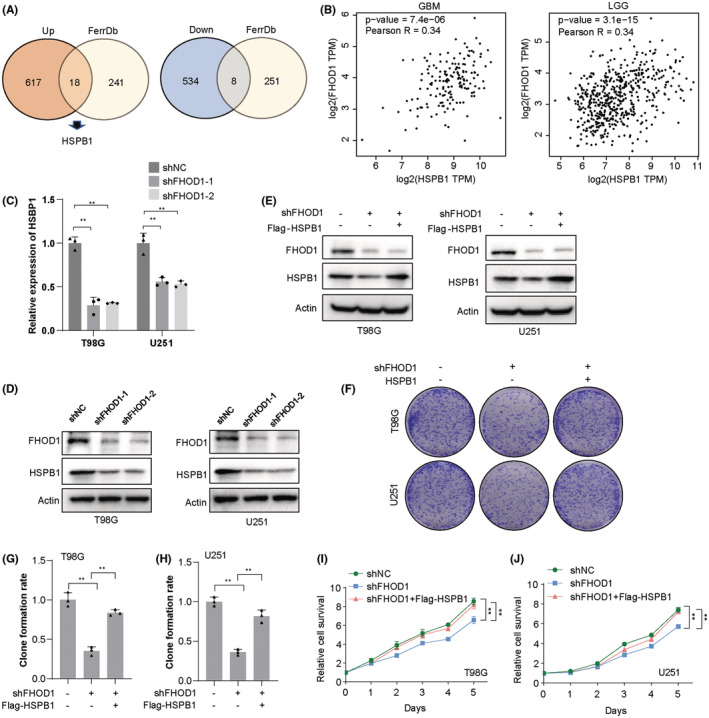
FHOD1 knockdown inhibited the ferroptosis‐associated HSPB1. (A) Venn diagrams identified the significantly upregulated HSPB1. (B) The correlation between FHOD1 expression and HSPB1 expression in GBM and LGG tissues. (C, D) Western blot and qRT‐PCR confirmed the down‐regulation of HSPB1 expression in FHOD1‐depleted T98G and U251 cells. (E) After FHOD1 knockdown and Flag‐HSPB1 overexpression, the total protein was extracted and analyzed by western blot with the indicated antibodies. (F) FHOD1‐depleted T98G and U251 cells reconstituted with Flag‐HSPB1 were used to detect the cell growth rates. (G, H) Quantification of cell growth determined by colony formation assay from (F). (I, J) FHOD1‐depleted T98G and U251 cells reconstituted with Flag‐HSPB1 were used to detect the cell proliferation rates. Error bars represented the mean ± SD from three independent experiments. **p < 0.01.