
FIGURE 7.
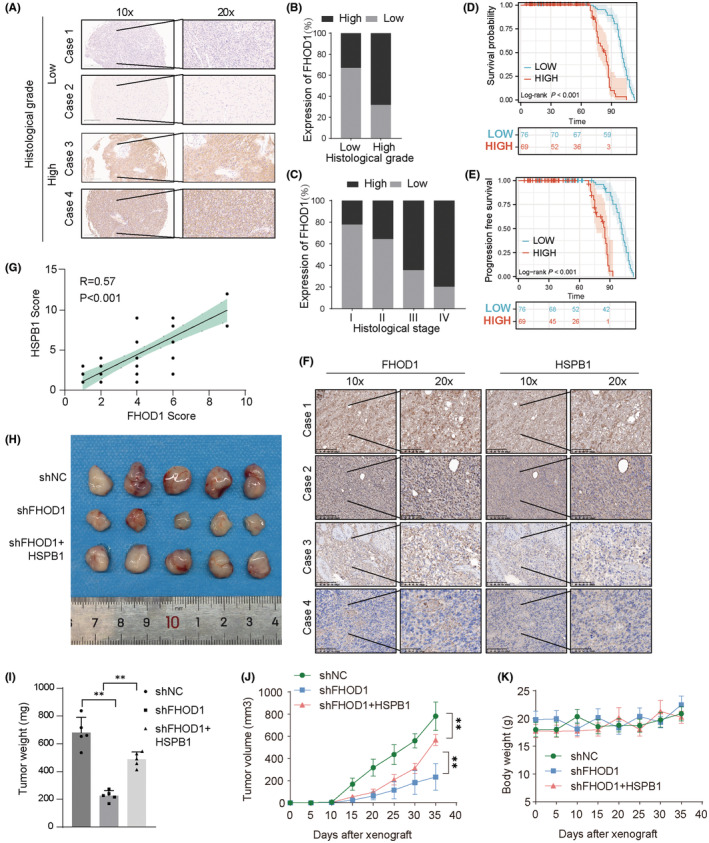
The clinical significance of FHOD1 in glioma. (A) The representative immunohistochemical staining of FHOD1 on glioma tissue microarray (n = 145). Scale bars are indicated. (B, C) Protein levels of FHOD1 was quantified in glioma specimens with different grades and stages. (D) The glioma patients with low FHOD1 expression displayed favorable OS. (E) The glioma patients with low FHOD1 expression displayed favorable PFS. (F) The representative immunohistochemical staining of FHOD1 on Xiangya glioma cohorts (n = 50). Scale bars are indicated. (G) Correlation analysis of FHOD1 and HSPB1 in glioma samples. Statistical analyses were performed with the χ2 test. The Pearson r indicates correlation coefficient. (H) The tumor tissues were harvested at the end of the experiment in each group. (I, J) The tumor weight and tumor volume of each group in glioma xenograft models. The asterisks (**) indicate the following: FHOD1 knockdown vs. control (p < 0.01) and FHOD1 knockdown + HSPB1 overexpression vs. FHOD1 knockdown (p < 0.01). (K) The body weight curves of each group in glioma xenograft models.