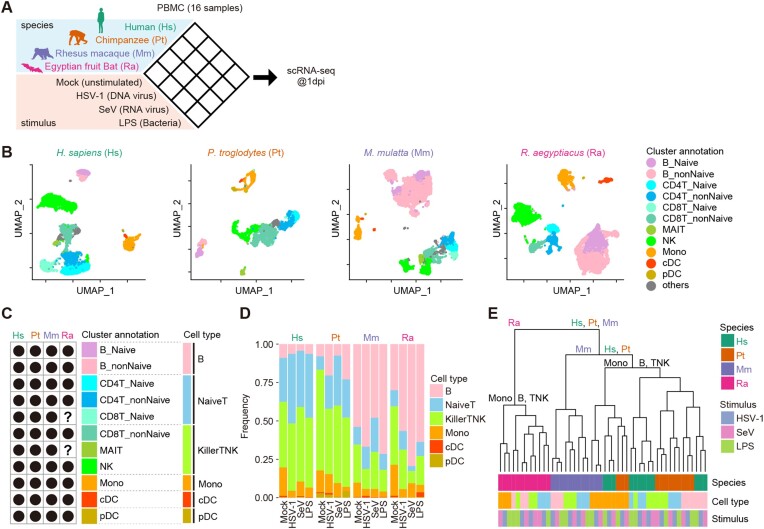
Figure 1:
scRNA-seq analysis of PBMCs from 4 animal species inoculated with pathogenic stimuli. (A) Schematic of the experimental design. See also Supplementary Fig. S1. (B) Uniform manifold approximation and projection (UMAP) plots representing the gene expression patterns of the cells from the 4 species. Each dot is colored according to the cell type. Gray dots indicate cells unassigned into any cell type. See also Supplementary Fig. S2. (C) Comparison of identified cell types among the species. Dot: detected, question mark: undetected. The definitions of 6 species-common cell types are shown on the right side. See also Supplementary Fig. S2H. (D) The cellular compositions of PBMC samples. The compositions according to the 6 common cell types are shown. (E) Hierarchical clustering analysis of 48 pseudobulk datapoints (4 animal species × 3 stimuli × 4 cell types = 48 conditions) based on PC1-30 calculated from the fold-change values (respective stimulus versus unstimulated) for gene expression.

