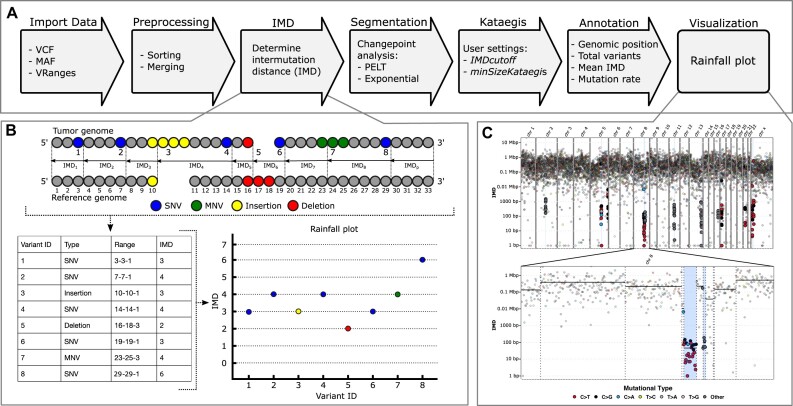
Figure 1:
Overview of the Katdetectr workflow, intermutation distance, and rainfall plots. (A) General workflow of Katdetectr from data import to data visualization represented by arrows. (B) The intermutation distance (IMD) is determined for all genomic variants in each chromosome, and rainfall plots are used to visualize the IMDs. Single-nucleotide variant (SNV), multinucleotide variant (MNV). (C) Rainfall plot of WGS breast cancer sample PD7049a as interrogated by Katdetectr with IMDcutoff = 1,000 and minSizeKataegis = 6 [2]. Y-axis: IMD, x-axis: variant ID ordered on genomic location, light blue rectangles: kataegis loci with genomic variants within kataegis loci shown in bold. The color depicts the mutational type. The vertical lines represent detected changepoints, while black horizontal solid lines show the mean IMD of each segment.

