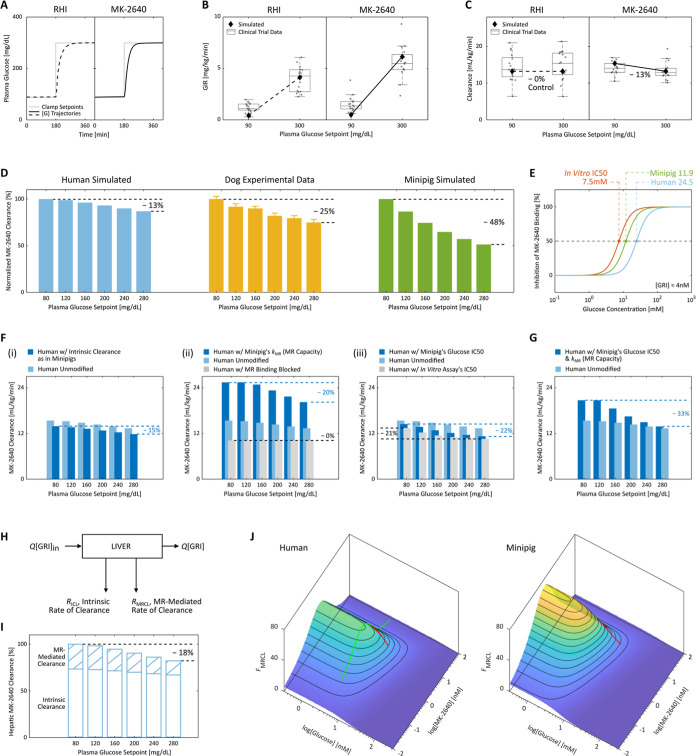
Figure 4.
Subpar glucose responsiveness of MK-2640 clearance in humans and investigation into the hypothesized causes of the unsuccessful clinical translation. (A–C) In Merck’s clinical trial 2,18 type 1 diabetic patients were clamped first at 90 mg/dL for 3 h and subsequently at 300 mg/dL for 4 h, with continuous intravenous infusion of either 1.4 pmol/kg/min of RHI (A, left) or 40 pmol/kg/min of MK-2640 (A, right). A glucose-dependent PD response was observed (B), as the GIR increased by 4.1 mg/kg/min for MK-2640 (5.6 in simulation) and only 3.2 mg/kg/min for RHI (3.7 in simulation) between the two setpoints. Despite moderate PD responsiveness, the PK of MK-2640 barely changed (C) with a mere 6% difference in clearance (13% in simulation), which directly contradicted the essence of the design concept. Each gray circle in (B,C) represents a single measurement. (D) We performed a straightforward comparison across species by subjecting our human (blue) and minipig (green) models to the same multi-glycemic clamp protocol previously applied to dogs (yellow). The modulation in clearance was predicted to be 13% in humans between 80 and 280 mg/dL, expectedly close to the clinical trial 2 outcome. In comparison, a 25% change was observed in canine experiments (“∼30%” claimed by Kaarsholm et al.21) and 48% in simulated minipigs. Error bars: digitized standard error. (E) Both the parameterized minipig and human models exhibited inhibition curves shifted away from that predicted by the in vitro MR binding assay (also see Figure 1B). This drift caused a 50% increase in MR IC50 for MK-2640 in minipigs and a 2.3-fold increase in humans, meaning reduced competition from glucose. (F) Predicted MK-2640 properties that hindered the clinical translation. (i) If humans hypothetically assume the same extent of MK-2640 elimination as minipigs via the intrinsic IR-mediated route, the clearance change across the glycemic region was predicted to be 15%, not far from the original 13% in panel (D). On the other hand, we found the interspecies differences in MR-mediated clearance capacity (ii) and MR IC50 (iii, representative of the glucose competitiveness) to be strongly correlated with differences in MK-2640 PK. (G) Only the transposition of both factors in panel (F) (ii,iii) from minipigs to humans resulted in a modulation beyond 30%, a threshold critical to MK-2640’s entry into the clinical stage. (H) Schematic of the local mass balance of MK-2640 in the liver. Q, blood flowrate; [GRI]in and [GRI], local MK-2640 concentrations into and out of the liver compartment. (I) IM3PACT simulations confirmed the Merck team’s hypothesis that the local hepatic MK-2640 PK demonstrates a more salient glucose responsiveness (a change of 18%) than that of the whole body. This improved result, however, still does not compare with the preclinical performances (panel D). (J) A simple proxy metric for the extent of MR-mediated MK-2640 clearance, FMRCL, can be derived from the liver mass balance in (H). FMRCL allows direct visualization of the dependence of competitive clearance on local glucose and GRI concentrations, based solely on MK-2640 parameters and the liver physiology without requiring simulation. Green curve, Merck’s clinical trial 1 on non-diabetic individuals (cf. Figure 3G); red curves, trial 2 protocol applied to diabetic humans and minipigs.

