
FIGURE 1.
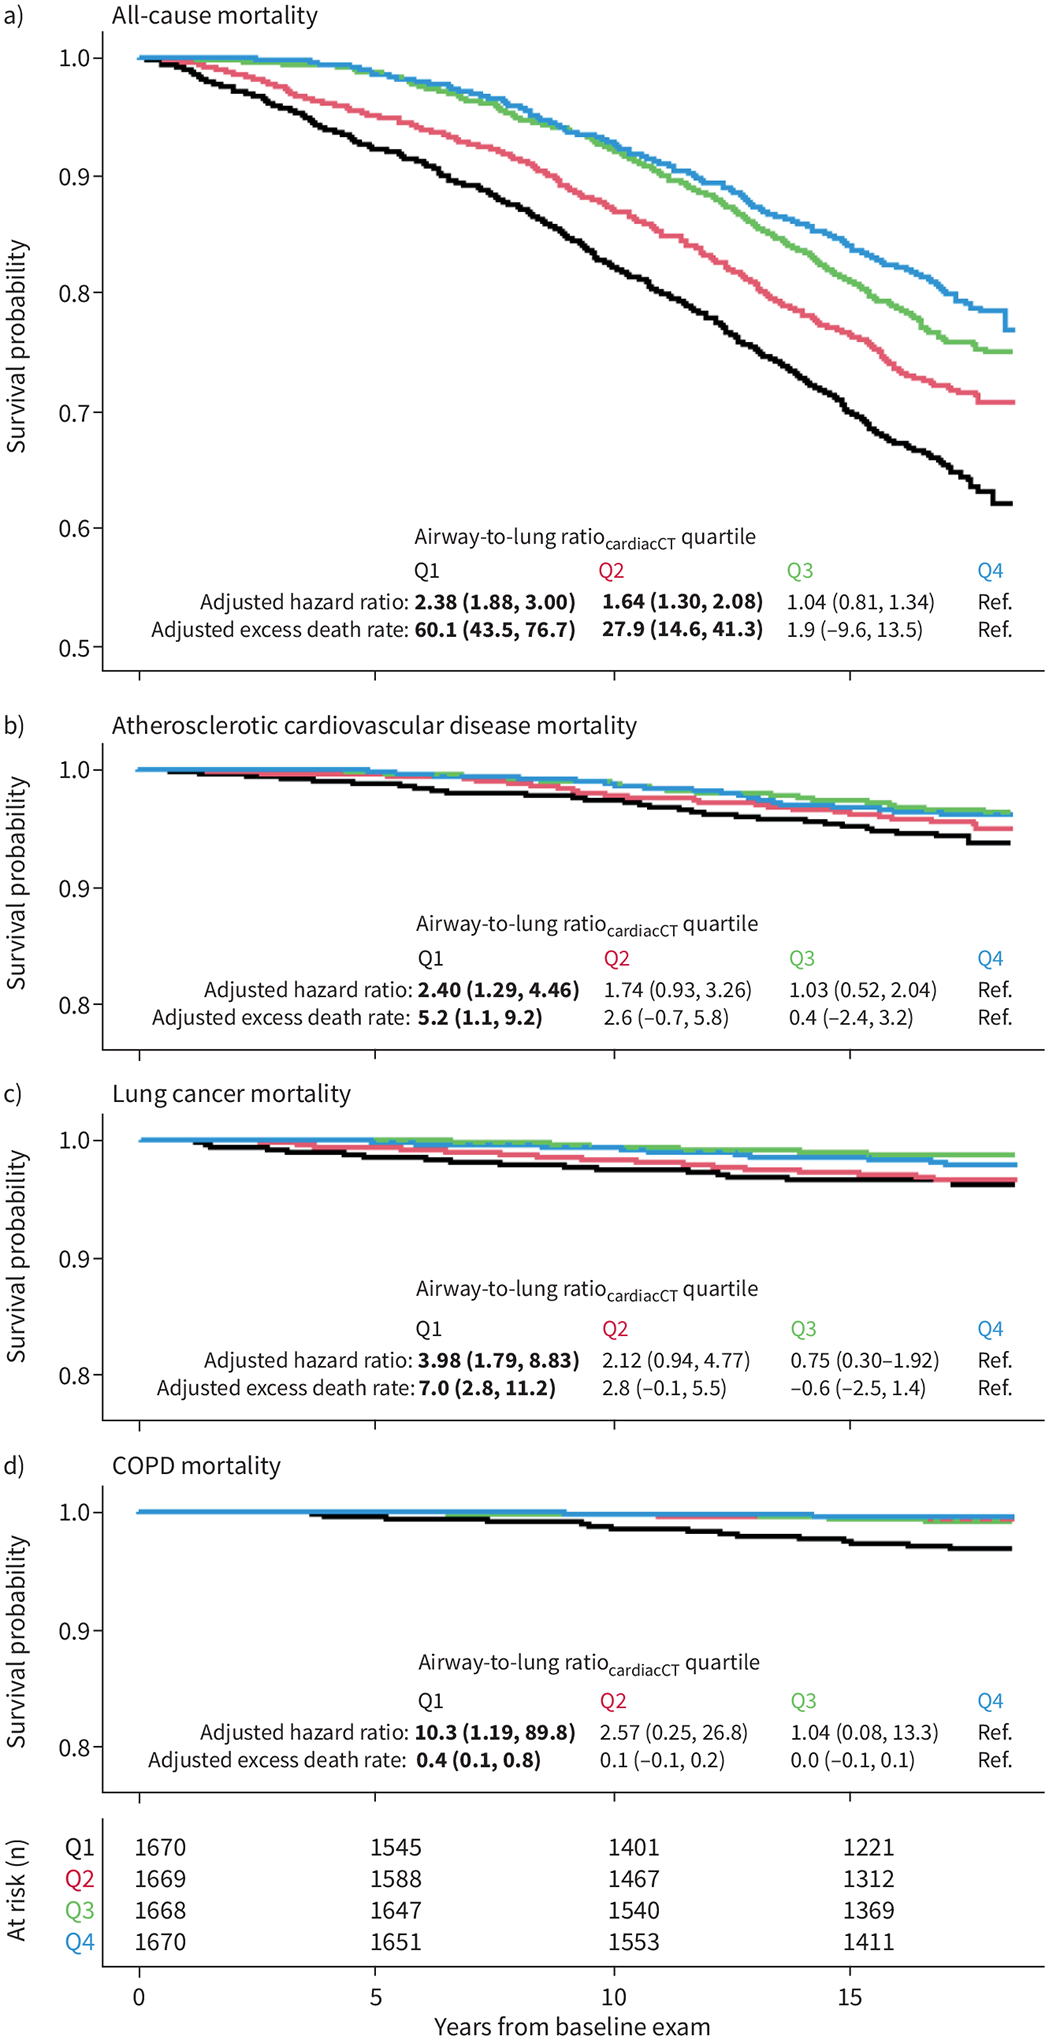
Association of computed tomography (CT)-assessed dysanapsis with mortality. Kaplan–Meier survival curves for a) all-cause mortality and b–d) cause-specific mortality by quartile of airway-to-lung ratiocardiacCT (calculated as the mean of airway lumen diameters (in cm) divided by the cube-root of total lung volume (in cm3) estimated from cardiac CT; black: quartile 1, smallest; red: quartile 2; green: quartile 3; blue: quartile 4, largest). Likelihood ratio test p<0.001 for each panel. The adjusted 10-year hazard ratios and excess death rates per 10 000 person-years were calculated using proportional hazard and Poisson regression models, respectively, adjusting for baseline age, age2, sex, height, body mass index (BMI), BMI2, race/ethnicity, principal components of genetic ancestry, health insurance status, educational attainment, study site, baseline cigarette smoking status, pack-years, pack-years2, cigar smoking status, cigar-years, pipe smoking status, pipe-years, environmental tobacco smoke exposure status, environmental tobacco smoke exposure (hours per week), environmental tobacco smoke exposure (hours per week)2, 1-year residential outdoor air pollutant concentrations (particulate matter with aerodynamic diameter <2.5 μm, oxides of nitrogen and ozone), physician diagnosis of asthma, spatial location of airways proportion sampled from core versus peel, left versus right, and upper versus mid versus lower lung zones and number of airways measured and voxel size. Cause-specific death was defined by the primary (underlying) International Classification of Diseases code listed as underlying cause of death (atherosclerotic cardiovascular disease: I21–25, I63, I65–66, I69.3, F01, I70–72, I74–75; lung cancer: C33–34; COPD: J41–44).