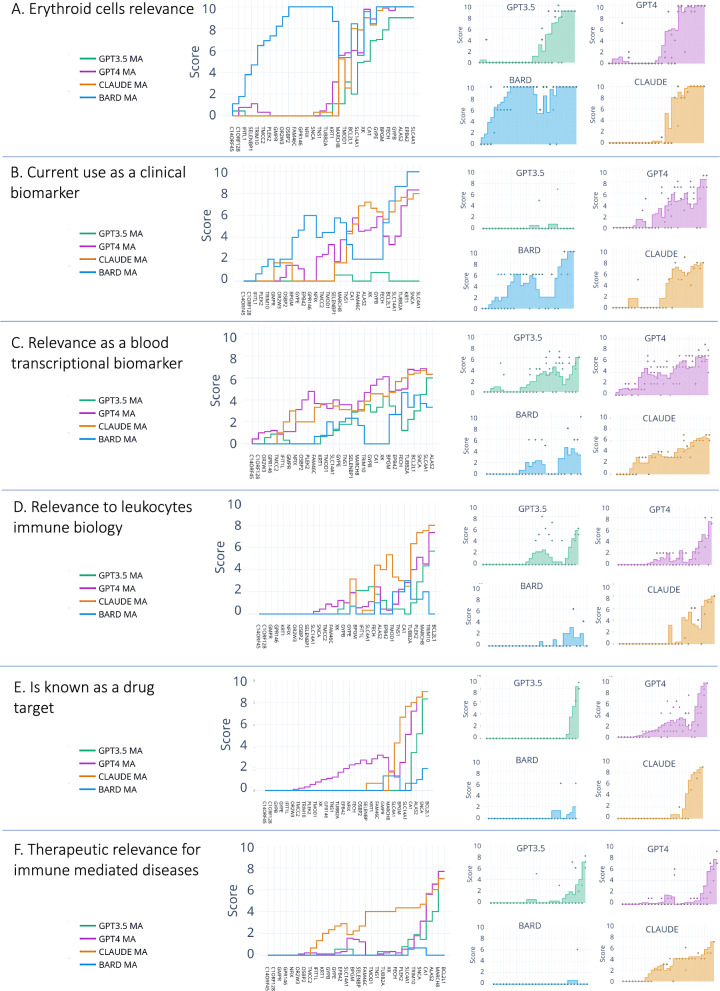
Fig. 3.
LLMs scoring of M9.2 genes across multiple criteria. Line graphs show scores attributed by four LLMs to 30 genes in module M9.2. Prompts were run in triplicate and scores plotted accordingly. Lines indicate moving averages. Genes on the x-axis were rank-ordered by averaged scores from the four models. Each panel shows scores obtained for one of six statements, which relate to the gene’s: A relevance to erythroid cells or erythropoiesis, B use as a clinical biomarker, C potential as a blood transcriptional biomarker, D relevance to leukocytes immune biology, E status as a known drug target, and F therapeutic relevance for immune mediated diseases. The actual prompts can be found in the methods section (Step 3)

