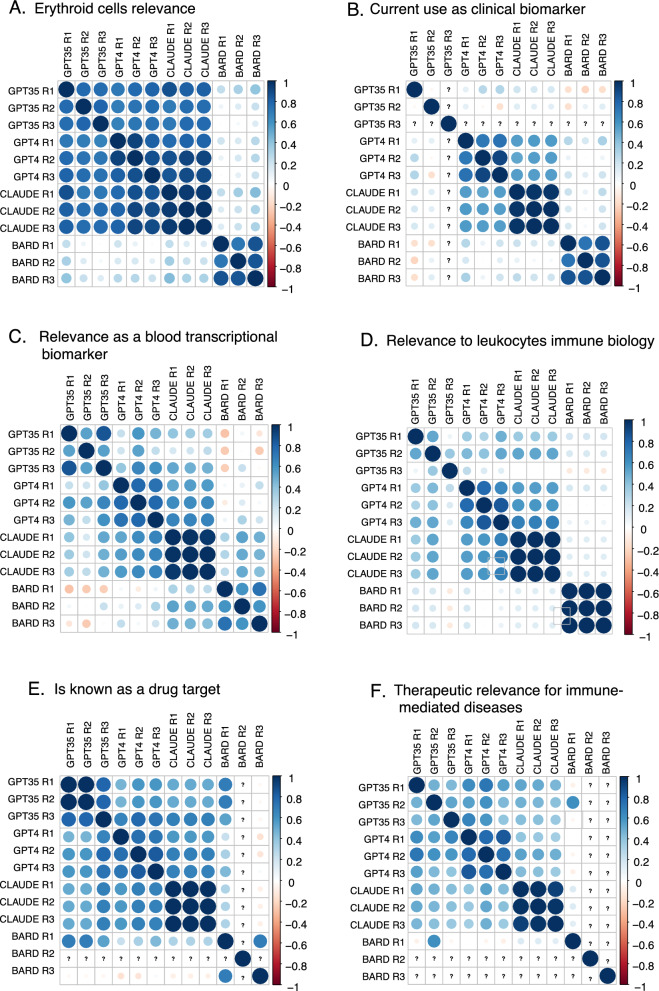
Fig. 4.
Benchmarking of LLMs on gene scoring tasks. Correlation plots show the degree of similarity between scores generated for a statement by four LLMs: GPT-3.5, GPT-4, Claude and Bard. Scores were generated in triplicate for each model. Plots show scoring similarities and differences within and between models. Each panel shows correlations for scores on a given statement regarding: A Relevance to erythroid cells or erythropoiesis. B Use as a clinical biomarker. C Potential as a blood transcriptional biomarker. D Relevance to leukocyte immune biology. E Status as a known drug target. F Therapeutic relevance for immune-mediated diseases. Actual statements and prompts can be found in the Methods section (Step 3)

