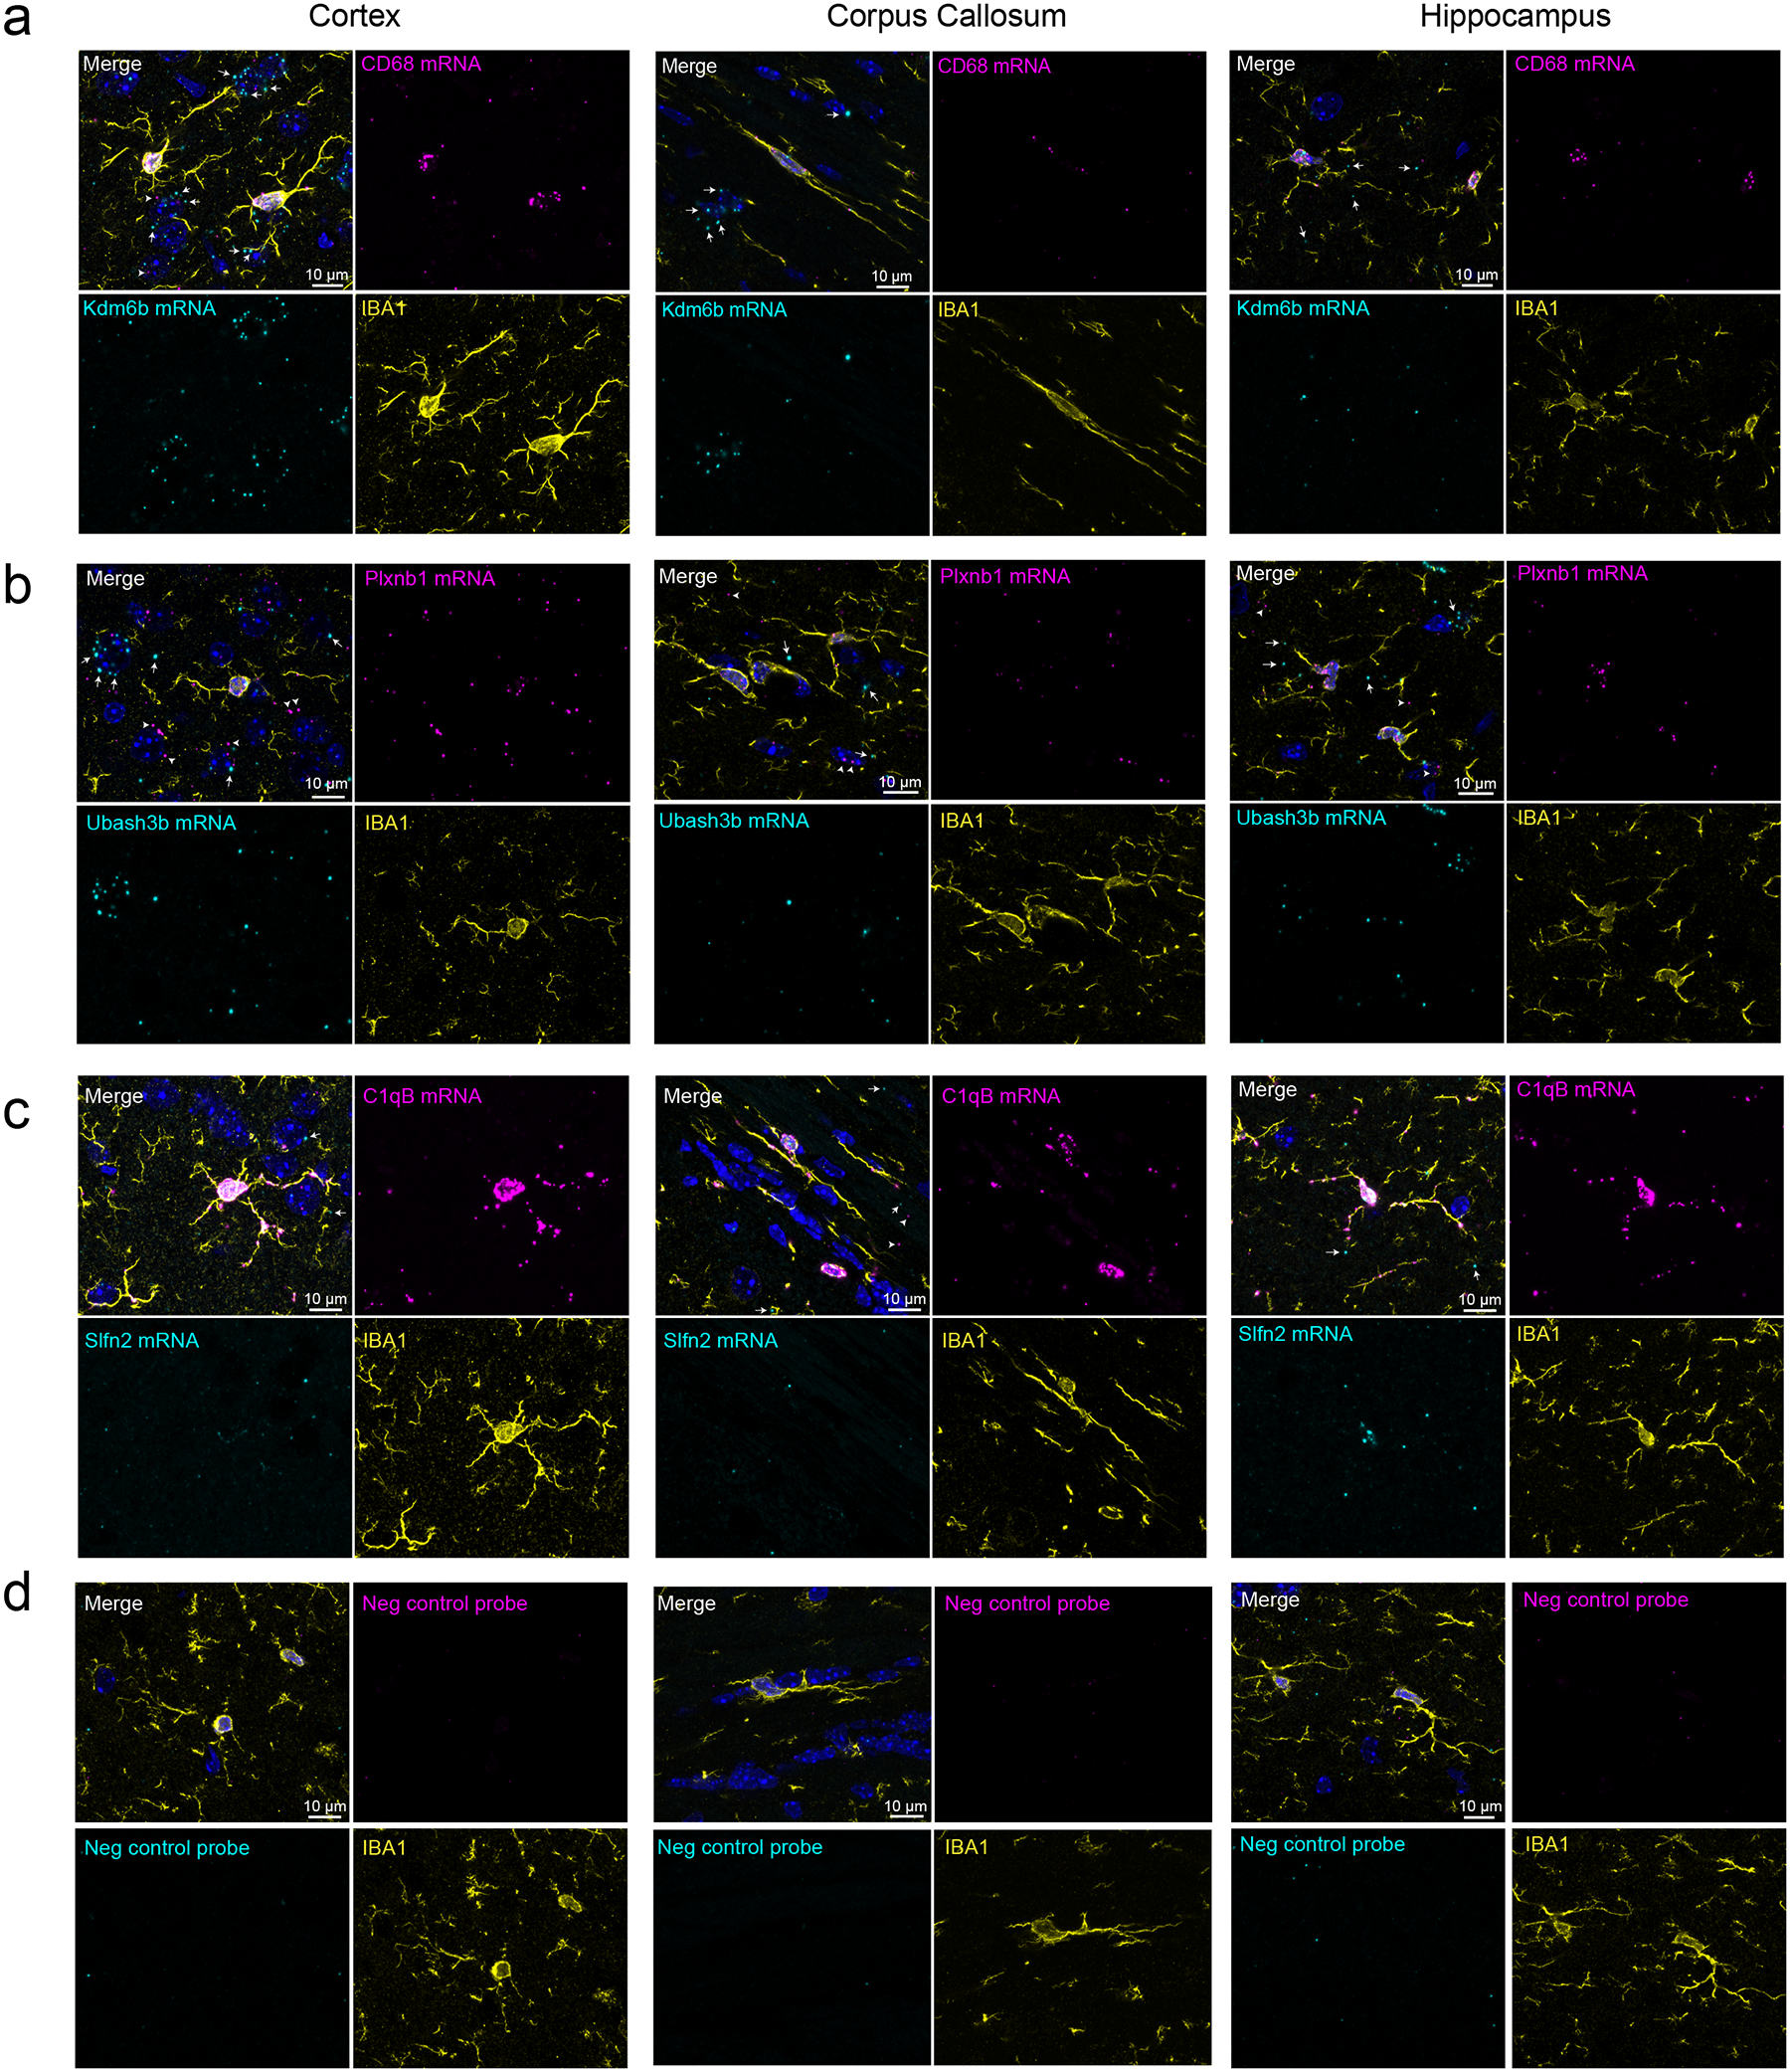
Extended Data Fig. 3. Multiplex in situ hybridization (ISH) shows transcript localization for PeMP and non-PeMP transcripts.

Maximum intensity projections of a 2 μm Z-stack image from ISH on p28 C57Bl/6 cortex, hippocampus, and corpus callosum tissue, for simultaneous PeMP-enriched vs. non-PeMP-enriched transcript detection in tandem with IBA1 immunofluorescence. Probes for PeMP-enriched transcripts shown in magenta and probes from non-PeMP-enriched transcripts shown in cyan. White arrows depict non-microglial signal emanating from somal-enriched probes, Kdm6b (a) and Ubash3b (b), while white arrowheads depict non-microglial signal emanating from PeMP-enriched probe, Plxnb1 (b). Images were also taken from negative control probes (d) to assess background signal levels. Quantifications are shown in Fig 2k–l. Representative images shown from n=5 mice and at least 4 z-stacks per brain region per mouse.
