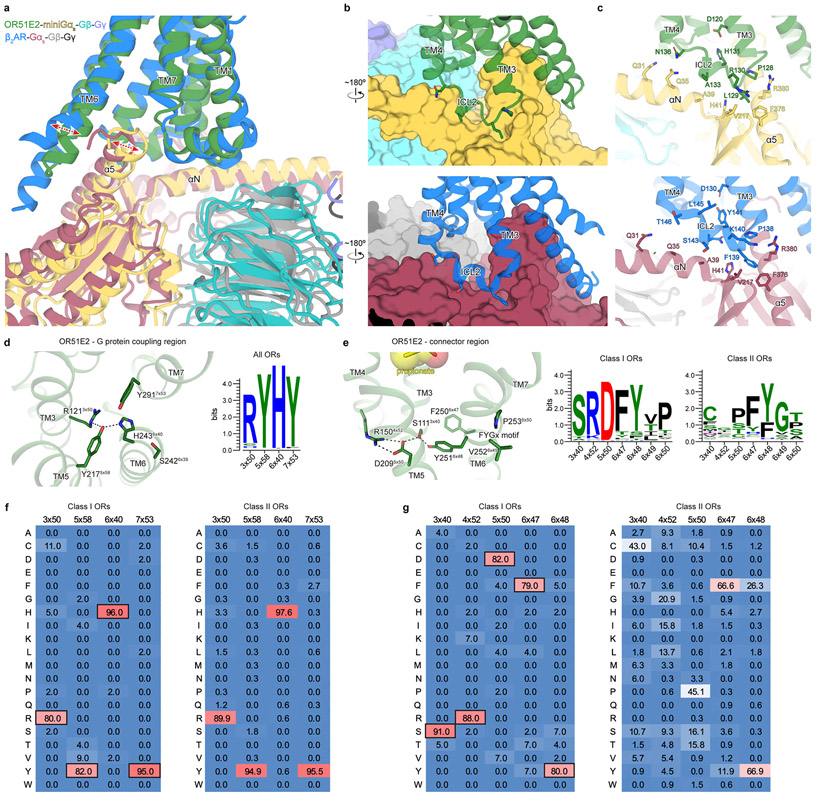
Extended Data Figure 7. Analysis of active state structure of OR51E2.
a) Structural comparison of G protein interaction for OR51E2 (green) and β2-adrenergic receptor (β2AR in blue, PDB code: 3SN6). b) Close-up views of intracellular loop 2 (ICL2) interaction with the Gαs subunit shown in surface representation. c) interactions between residues in ICL2 and the αN and α5 helices of the Gαs subunit. d) G protein-coupling region of OR51E2 is shown along with a weblogo (right) highlighting conservation of key residues for all human ORs. e) Residues that participate in the extended interaction hydrogen bonding network between TM3, TM4, TM5, and TM6 are conserved in human Class I ORs, but not in Class II ORs. f,g) The percentage of receptors harboring a given amino acid at each position are shown for all human Class I and Class II ORs at the G protein-coupling region and connector regions. OR51E2 residues at each position are indicated by a black box.

