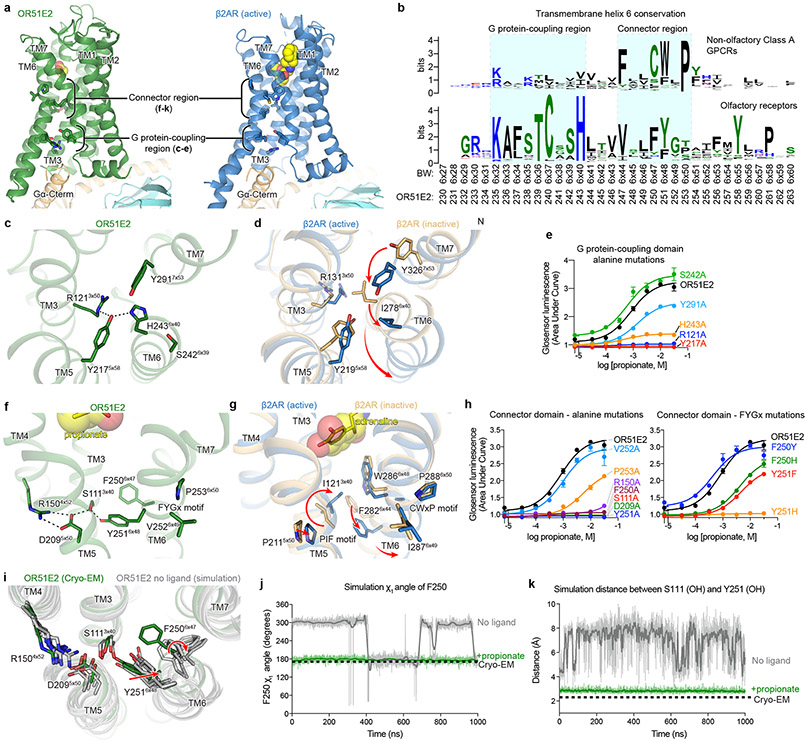
Figure 4. Activation mechanism of OR51E2.
a) Ribbon diagram comparing structures of propionate-bound OR51E2-miniGs complex (green) to BI-167107 bound β2AR-Gs complex (blue, PDB 3SN6). For both receptors, the connector region couples conformational changes at the ligand binding site with the G protein-coupling region. b) Weblogo depicting conservation of transmembrane helix 6 in either human odorant receptors or human non-olfactory Class A GPCRs. Amino acid numbering for OR51E2 and Ballosteros-Weinsten (BW) are indicated. Close-up view of the G protein-coupling domain in active OR51E2 (c) and both active and inactive β2AR (d). Activation of β2AR is associated with an inward movement of TM7 and a contact between Y2195x58 and Y3267x53. In OR51E2, H2436x40 interacts with Y2175x58 in the active state. e) Alanine mutagenesis of G protein-coupling domain residues in OR51E2 using a real-time cAMP concentration assay. Close-up views of the connector region in active OR51E2 (f) and both active and inactive β2AR (g). h) Mutagenesis of connector region residues in OR51E2 using a real-time cAMP concentration assay. i) Molecular dynamics simulations of OR51E2 with propionate removed. Snapshots displayed are the last snapshot from each of the five independent simulation replicates after 1000 ns of simulation time. Simulations show increased flexibility of TM6 in the connector region residues. Snapshots extracted from unbiased clustering analysis of the entire ensemble of MD trajectories show similar structural changes as these last snapshots (see Methods section, Supplementary Table 7 and Supplementary Fig. 1). Molecular dynamics trajectories for a representative simulation showing rotation of side chain rotamer angle of F2506x47 (j) and minimum distance between S1113x40 and Y2516x48 hydroxyl groups (k) performed with or without propionate over the course of 1000 ns MD simulation (see Extended Data Fig. 8 for simulation replicates). Thick traces represent smoothed values with an averaging window of 8 nanoseconds; thin traces represent unsmoothed values. Data points in e and h are mean ± standard deviation from n = 4 experiments.

