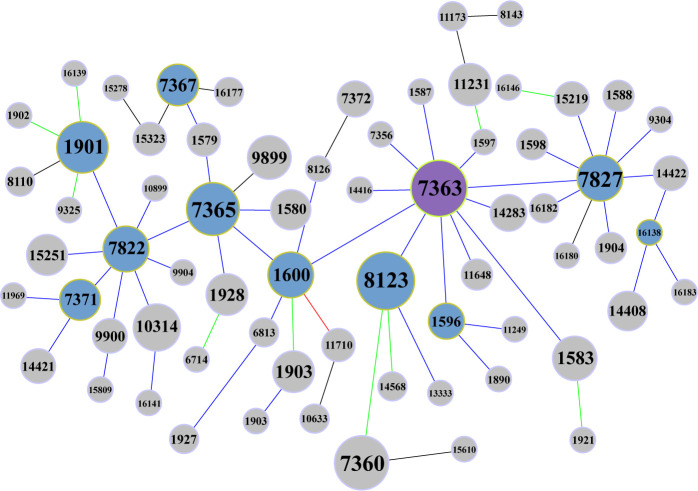
Fig 2.
Group 0 of goeBURST analysis. The frequency of occurrence is represented by the font size of MLST STs and the size of the nodes. Node color: purple, group founder; desaturated blue, subgroup founder; light gray, common node. Link color: black, link drawn without recourse to tiebreak rules; blue, link drawn using tiebreak rule 1 (number of SLVs); green, link drawn using tiebreak rule 2 (number of DLVs); red, link drawn using tiebreak rule 3 (number of TLVs).

