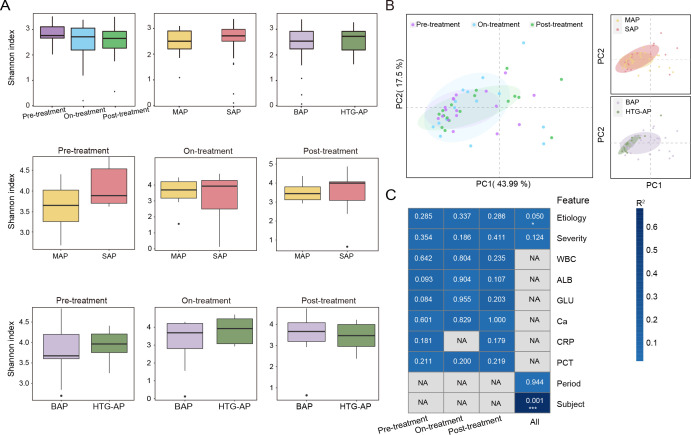
Fig 1.
Diversity and drivers of gut microbiome composition of patients with AP. (A) Alpha-diversity (Shannon index) among the treatment phase, severity, and etiology groups at the species level. (B) PCoA of Bray-Curtis distance on all samples based on species level. (C) PERMANOVA test was used to detect the independent effects of clinical features on microbial community (Bray-Curtis distance, 999 permutations). The heat map was colored with R 2 values. P values were presented on each cell. Clinical features included subject, age, etiology, severity, WBC, ALB, GLU, Ca, CRP, and PCT. *P < 0.05, **P < 0.01, and ***P < 0.001.

