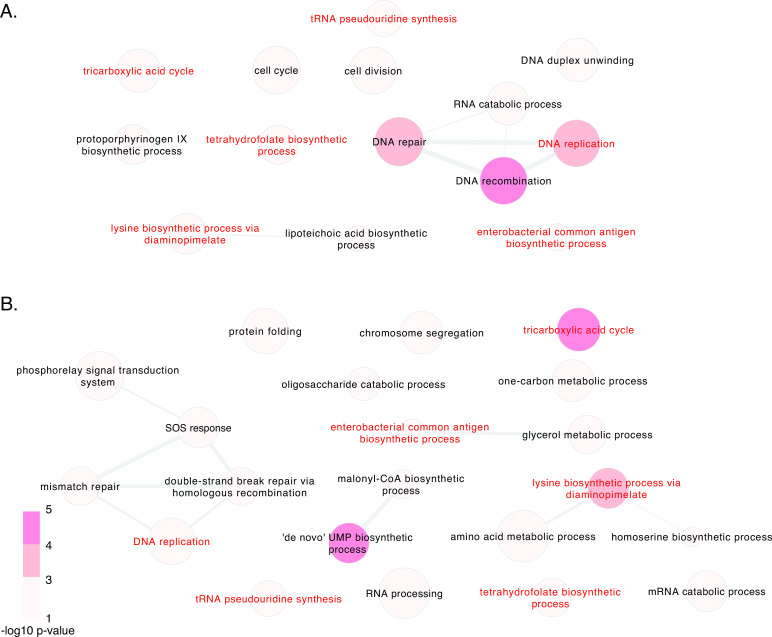
Fig 3.
Pathway enrichment of genes contributing to macrophage invasion in S. aureus. Genes significant by Tn-Seq after macrophage invasion at adjusted P-value < 0.05 are represented, as determined by comparing initial transposon mutant library pools to mutants surviving following invasion. The color of circles corresponds to the P-value for each Gene Ontology (GO) category, and the size is proportional to the Log10 size of each GO term. The thickness of connecting lines represents semantic similarity between categories, and the spatial arrangement of discs approximately reflects the grouping of categories by semantic similarity. Results are separately displayed for strains ATCC29213 (A) and JE2 (B), with pathways common to both strains labeled in red.

