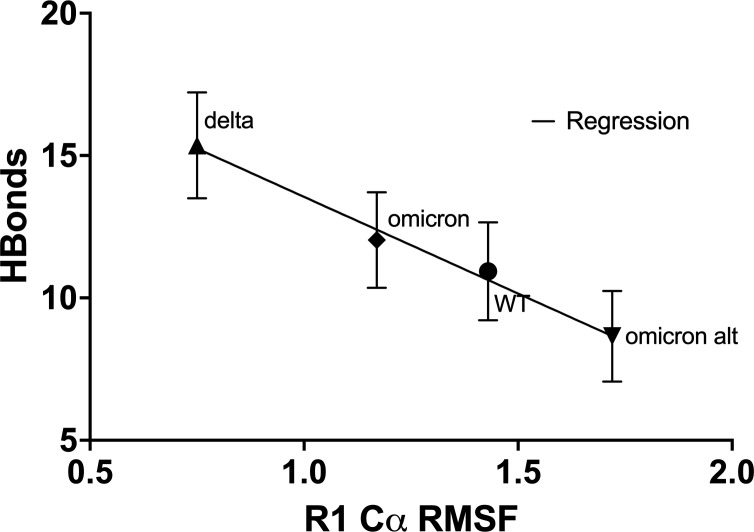
Fig 5.
Correlation of FCD-Furin interfacial H-bond count with RMSF of the first residue in FCD. The higher the RMSF of the first residue in the FCD, the harder it is to bind to the furin, especially for the critical fifth residue which inserts into the furin pocket as shown in Fig. 1D. R1 is residue 681 for all but the alternate omicron sequence which starts at residue 79. Full simulation data (RMSF/D) is provided in the repository link of the Supplemental Material. All P-values for H-bond counts between pairs are reported in Fig. 2. The equation of the regression line is Hbonds = −6.7 ± 0.7(RMSF) + 20.1 ± 0.9, with regression coefficient R 2 = 0.98 and is probably negative with P = 0.01 (significant).

