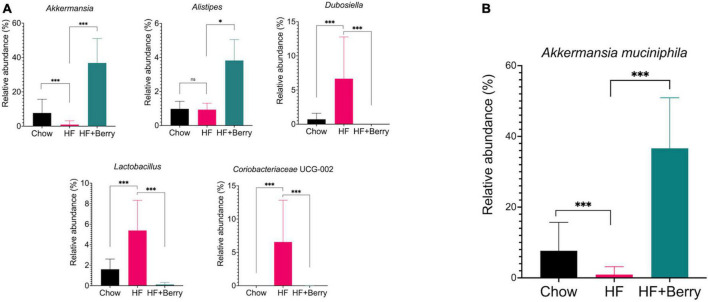
FIGURE 9.
Composition of the gut microbiota at genus and species level in cecum of mice fed chow, HF or HF + Berry diets for 18 weeks. (A) Depicts the composition of the gut microbiota at genus level. (B) Relative abundance at species level of Akkermanisa muciniphila. Values represent mean ± SD for n = 12 per diet group. Each group were compared to HF control group using two-way ANOVA and the p-values were corrected for multiple comparisons by controlling the False Discovery Rate (FDR) using the original FDR method of Benjamini and Hochberg. Significant differences denoted *p < 0.05 and ***p < 0.001.

