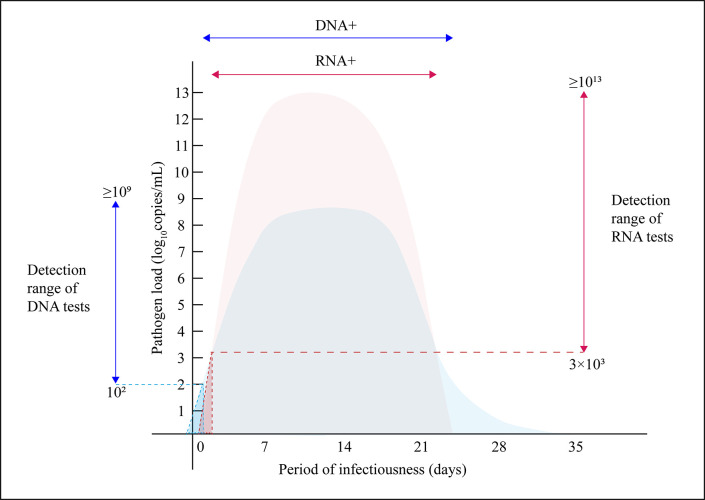
Fig 4.
Schematic of bacterial dynamics during the period of RTIs. The light blue area and light red area represent the dynamic variation of pathogen DNA and rRNA concentrations, respectively. The vertical blue line and red line with arrows represent the detection range of DNA and RNA tests, respectively. The horizontal blue and red lines with arrows represent the DNA-positive and RNA-positive periods, respectively. The blue triangular area depicted by the blue dashed lines and the red triangular area depicted by the red dashed lines represent the false negative area of DNA and RNA tests, respectively.

