
Fig 4.
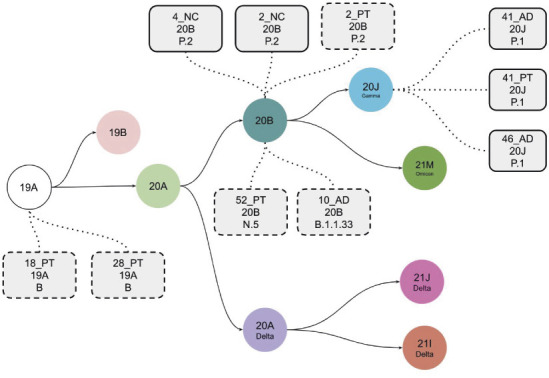
Schematic representation of the evolution of SARS-CoV-2 clades. Each clade is represented by a color circle, and the samples sequenced in the present cohort with the mutational patterns represented by gray rectangles containing the following information, from top to bottom: sample ID, the clade, and the Pangolin lineage assigned by NextClade. The solid rectangles represent SARS-CoV-2 genomes assembled with higher coverage, and the dashed ones represent those with lower coverage but carrying enough defining mutations to enable lineage assignment (AD, adenoid; PT, palatine tonsil; NC, nasal cytobrush).