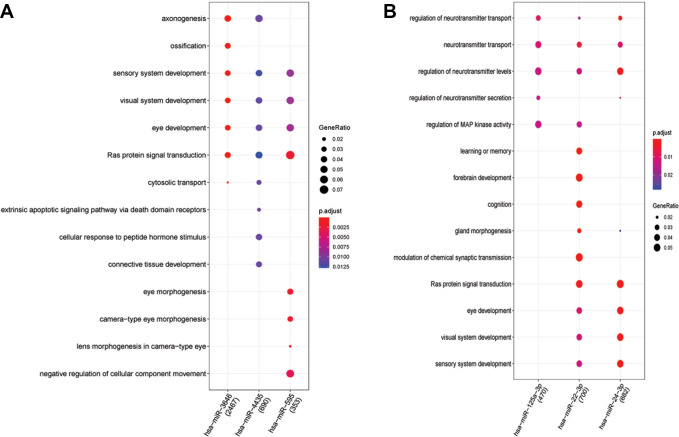
Figure 3.
A, It reveals 575 BP results of up-regulated miRNAs (hsa-miR-3646, hsa-miR-4435 and hsa-miR-595). B, It reveals 515 BP results of down-regulated miRNAs (hsa-miR-125a-3p, hsa-miR-22-3p and hsa-miR-24-3p). The tendency of GeneRatio was represented by the size of the circle. The tendency of P value was represented by the color.

