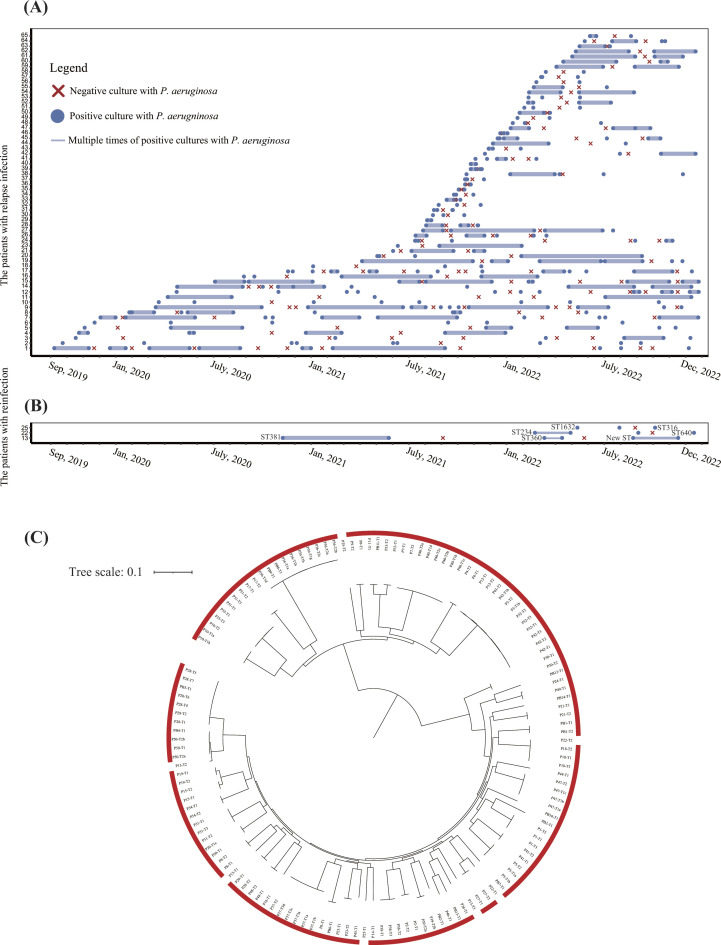
Fig 1.
Identification of relapse infection by screening of clinical data and whole-genome sequencing. (A) Timelines of relapse P. aeruginosa infection for each patient. Data are shown for isolates of 62 patients (1–62) from 1 September 2019, to 31 December 2022. The blue dots represent the positive cultures with P. aeruginosa isolates. The red forks represent negative culture with P. aeruginosa isolates. The docs connected with solid lines represent multiple times (>2) of positive cultures with P. aeruginosa isolates. (B) Timelines of reinfection of P. aeruginosa for each patient. Sequence type (ST) of the isolate was annotated beside the dot. (C) Phylogenetic tree of 163 P. aeruginosa isolates from 65 patients with multiple times of P. aeruginosa infections. The tree was constructed using core genome SNPs with maximum likelihood method. The isolates labeled with red frame indicate the relapse infection, while no frame indicates reinfection.

