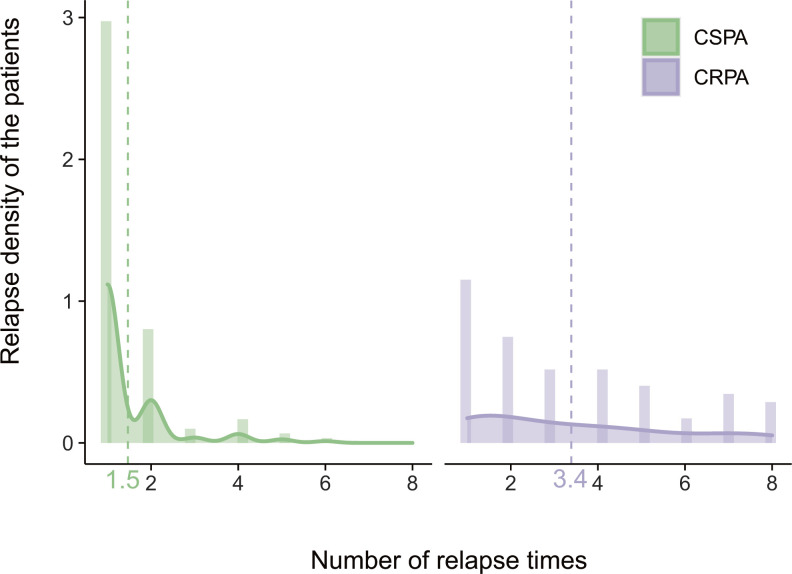
Fig 2.
Density of relapse times for CRPA and CSPA isolates The x-axis represents the number of relapse times, while the y-axis represents the relapse density of the patients. Vertical dotted line represents the mean value of relapse times. CRPA, carbapenem-resistant P. aeruginosa; CSPA, carbapenem-susceptible P. aeruginosa.

