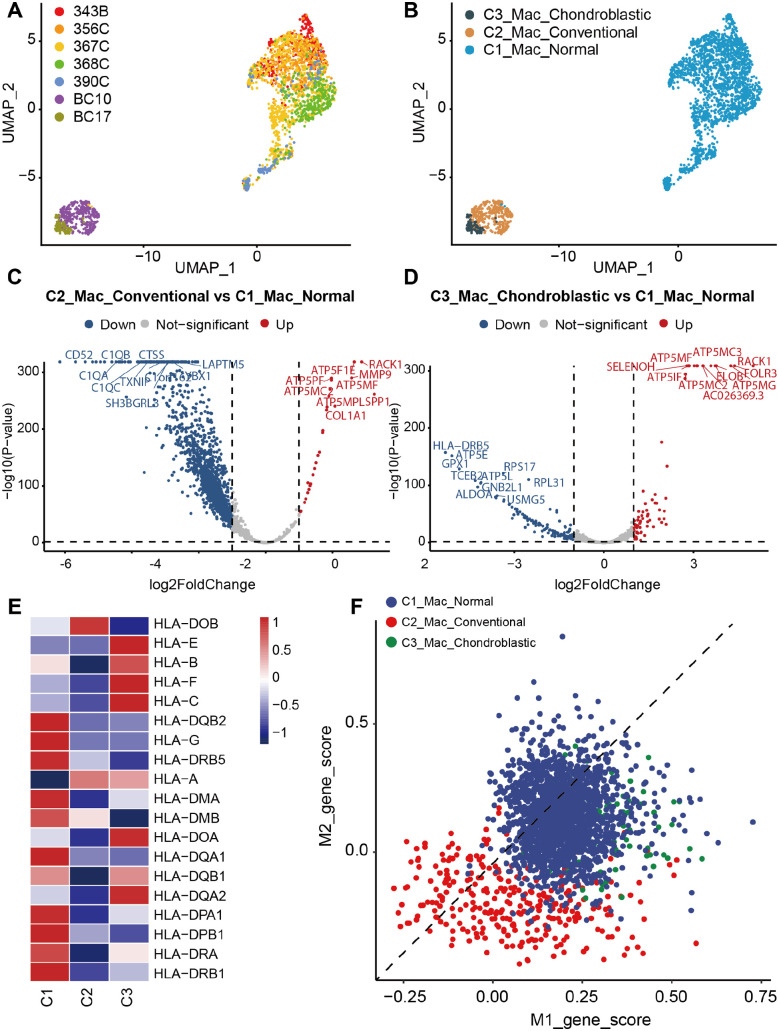
Figure 2.
Comparison of different types of macrophages (Mac) between osteosarcoma metastatic lung tissues and normal lung tissues. UMAP plots showing (A) the sample origin and (B) histopathology classification of macrophages. (C) Volcano plot showing DEGs between C2_Mac_Conventional and C1_Mac_Normal. (D) Volcano plot showing DEGs between C3_Mac_Chondroblastic and C1_Mac_Normal. (E) Heatmap of antigen-presenting related genes among C1_Mac_Normal, C2_Mac_Conventional, and C3_Mac_Chondroblastic. (F) Scatter plots showing the M1 and M2 signature genes in each cell derived from C1_Mac_Normal, C2_Mac_Conventional, and C3_Mac_Chondroblastic.

