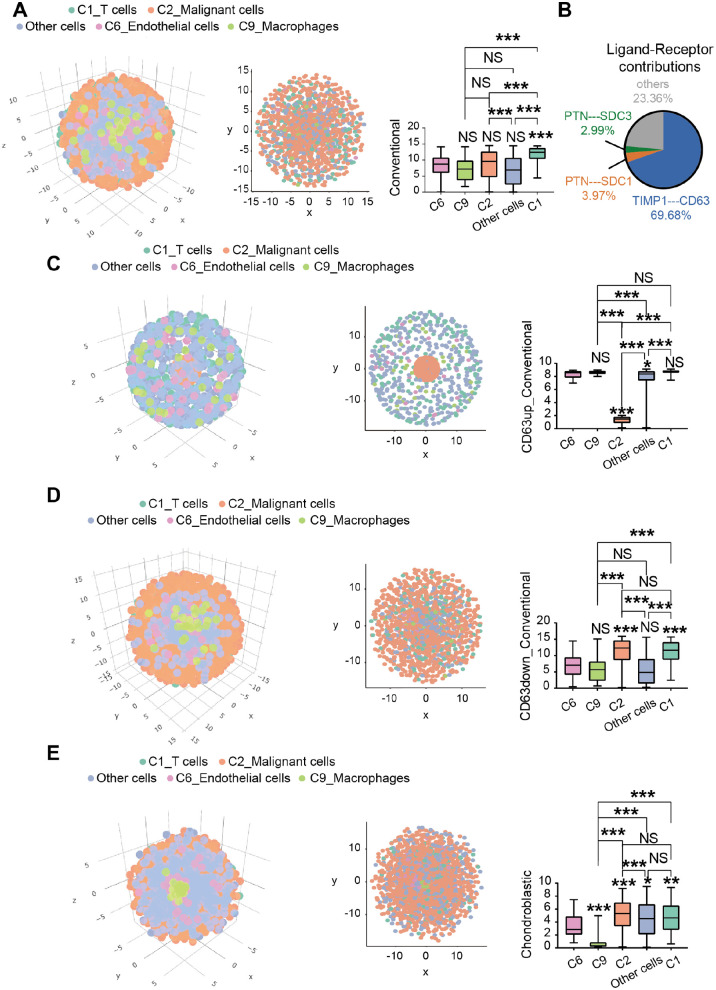
Figure 6.
CSOmap revealing the spatial information of malignant cells and T cells, endothelial cells, macrophages, and other cells. (A) Coordinate figure (left) and cross-section views (middle) showing the spatial information of malignant cells in conventional-type osteosarcoma lung metastasis, and histogram (right) showing the distance of cells-selected to the center of the three-dimensional axes. (B) The contribution of all ligand–receptor pairs to interactions between malignant cells and T cells, endothelial cells, macrophages, and other cells. (C) After upregulating the expression of CD63, the coordinate figure (left) and cross-section views (right) showing the spatial information of malignant cells, and the histogram (right) showing the distance of cells-selected to the center of the three-dimensional axes. (D) Coordinate figure (left) showing the global and cross-section (middle) views of spatial information of malignant cells after the downregulation of CD63, and histogram (right) showing the distance of cells-selected to the center of the three-dimensional axes. (E) Coordinate figure (left) showing the spatial information and cross-section views (middle) of malignant cells in chondroblastic-type osteosarcoma lung metastasis, and histogram (right) showing the distance of cells selected to the center of the three-dimensional axes (*P < 0.05, **P < 0.01, ***P < 0.001).

