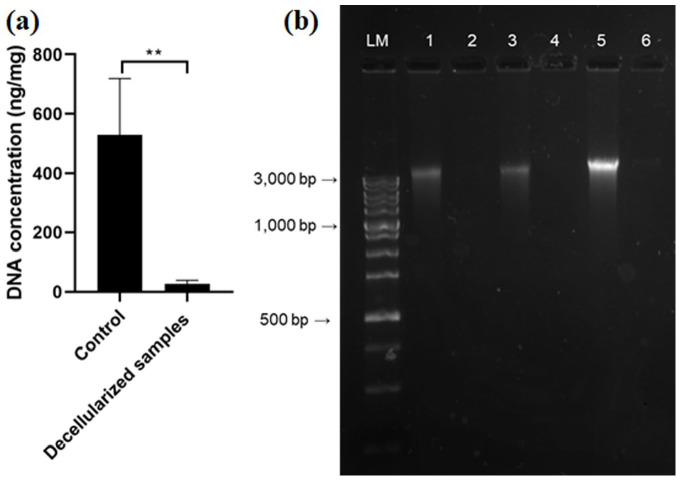
Figure 4.
(a) Quantification of DNA in native and decellularized sample (ng/DNA per mg/tissue dry weight). Results as mean ± SD, n = 12, **P ⩽ 0.001, t-test; (b) qualitative fragment length analysis of genomic DNA in 1.5% agarose gel.
LM: length ladder; 1, 3, and 5: native urethra samples; 2, 4, and 6: corresponding decellularized urethra samples.

