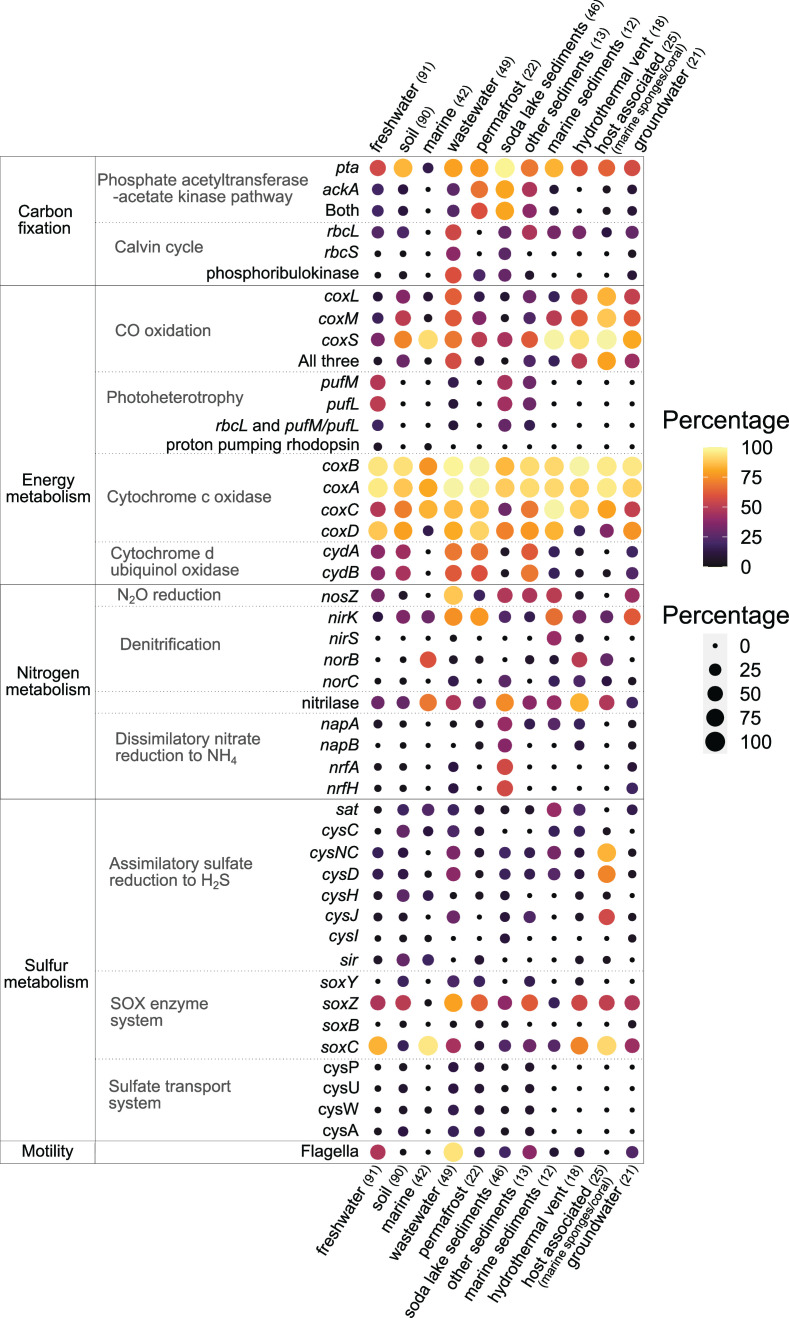
FIG 5.
Bubble plot showing the percentages of key genes involved in specific pathways present in Gemmatimonadota genomes from different environments. Dot color and size indicate the percentage of each gene in any given environment, with the darkest color and smallest size of the dot marking the absence of said gene in that environment. The number of MAGs in each environment is labeled in parenthesis. Details about genes presence/absence can be found in Table S6.

