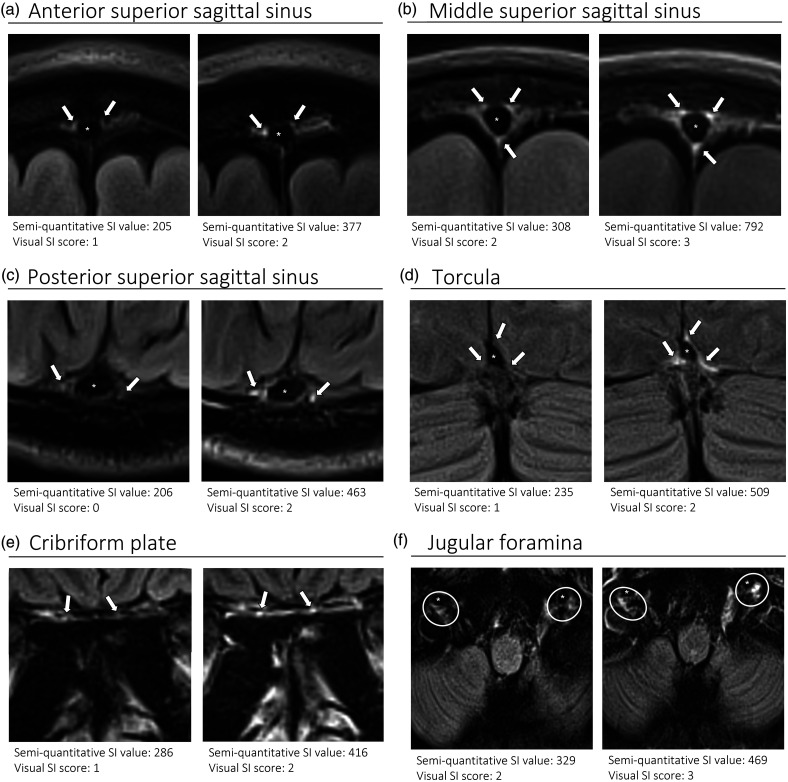
Figure 2.
Representative T2 FLAIR images showing signal intensity in dorsal and basal structures. Pre- (left side of all panels) and post-contrast (right side of all panels) in the same subject for each area of assessment (panels a–f) (different subjects for different areas).The measured semi-quantitative SI values in arbitrary units (the average of all regions of interest measured at the specific area) and qualitative, visual SI scores are indicated below the images from the individual subjects. For the areas along the superior sagittal sinus (SSS) there were punctate hyperintensities at either side and inferiorly to the sinus, representing meningeal lymphatics in cross section. The hyperintensities at the cribriform plate and jugular foramina were more diffuse. For the latter, the white circles indicate the area of the pars nervosa and not individual regions of interest. The arrows and asterisks indicate meningeal lymphatic structures and the lumen of venous vessels (SSS, jugular vein), respectively.
SI: signal intensity.

