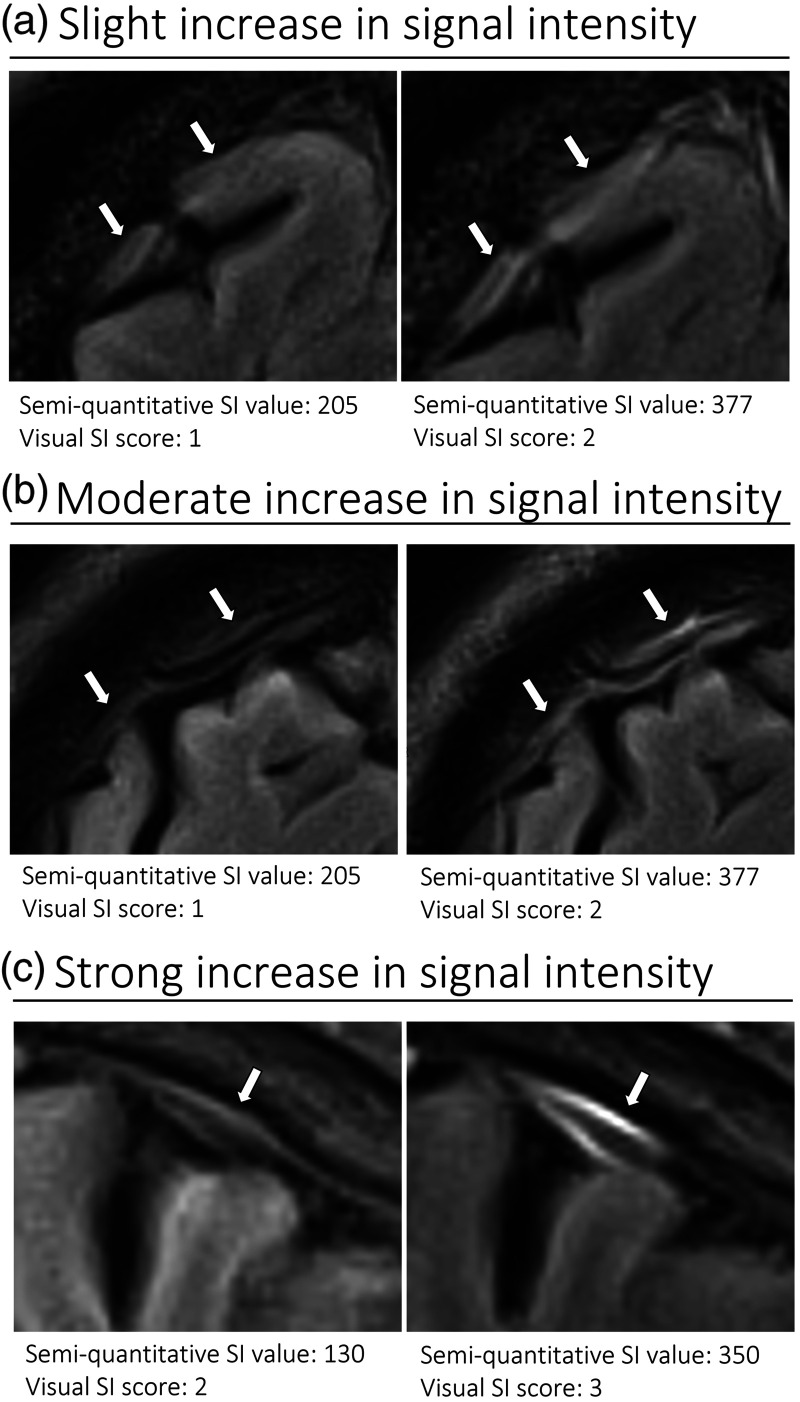
Figure 3.
Representative T2 FLAIR images of superficial cortical perivenous spaces. Pre- (left side of all panels) and post-contrast (right side of all panels) images in the same subject showing slight (a), moderate (b), and strong (c) increase in SI (different subjects for a, b, and c). The measured semi-quantitative SI values in arbitrary units (the average of all regions of interest measured at the specific area) and qualitative, visual SI scores are indicated below the images. The arrows indicate the perivenous spaces.
SI: signal intensity.

