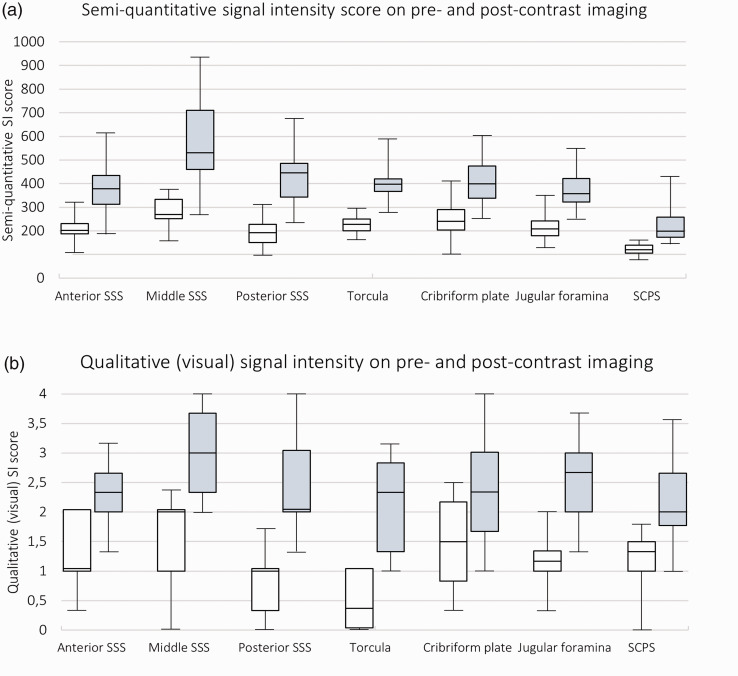
Figure 4.
Box plot diagrams showing signal intensity in the different areas of assessment. Pre- (white) and post-contrast (grey) semi-quantitative SI values in arbitrary units (a) and qualitative (visual) SI score (b). Median (25th–75th percentile). N = 19 except for analyses on perivenous spaces where there were three patients missing.
SCPS: superficial cortical perivenous spaces; SI: signal intensity; SSS: superior sagittal sinus.

