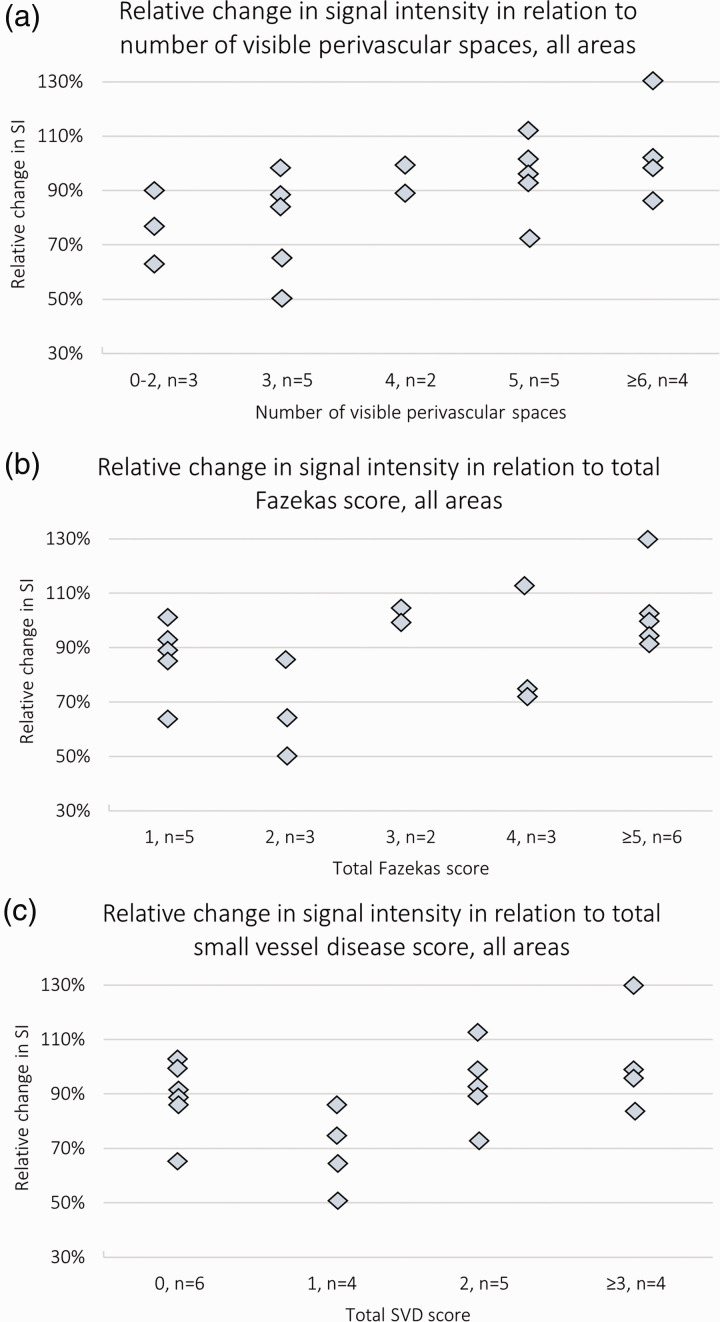
Figure 5.
Scatter plot diagrams showing the change in semi-quantitative signal intensity relative to markers of small vessel disease in each subject. The average change from all seven sites of measurement (as a proportion of the pre-contrast SI) in relation to the total number of visible perivascular spaces in the centrum semiovale and the basal ganglia (a), the total Fazekas score (b), and the total small vessel disease score (c). N = 19.
SI: signal intensity; SVD: small vessel disease.

