Table 1.
Details of the measurement of brain fluid outflow.
| Anatomical landmark | Projection | Plane of measurement | Measure | Example images | |
|---|---|---|---|---|---|
| Superior Sagittal Sinus | |||||
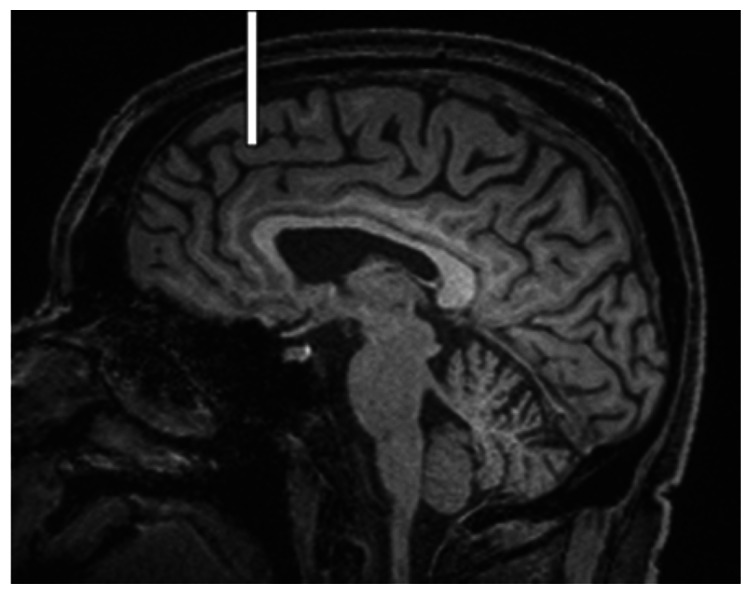
| Anterior | Anterior temporal pole | Coronal |
|
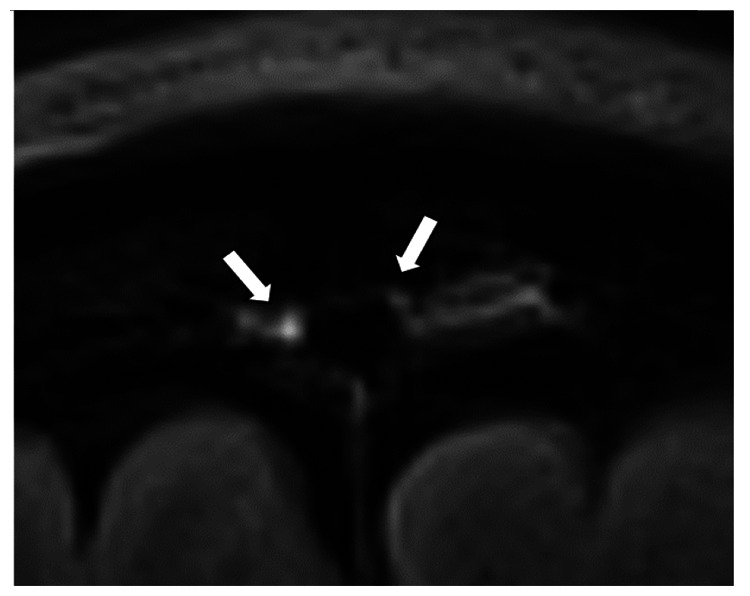
Pre- and post-contrast SI of meningeal lymphatics in cross section. Semi-quantitatively by placing 1 mm3 ROIs on 2 or 3 punctate hyperintensities. Qualitatively by visual scoring (0–4). |
|
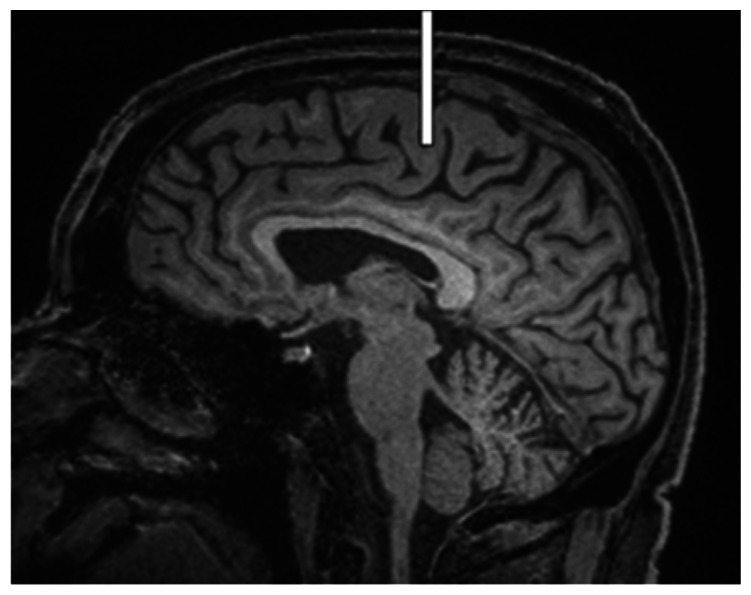
| Middle | 4th ventricle | Coronal |
|
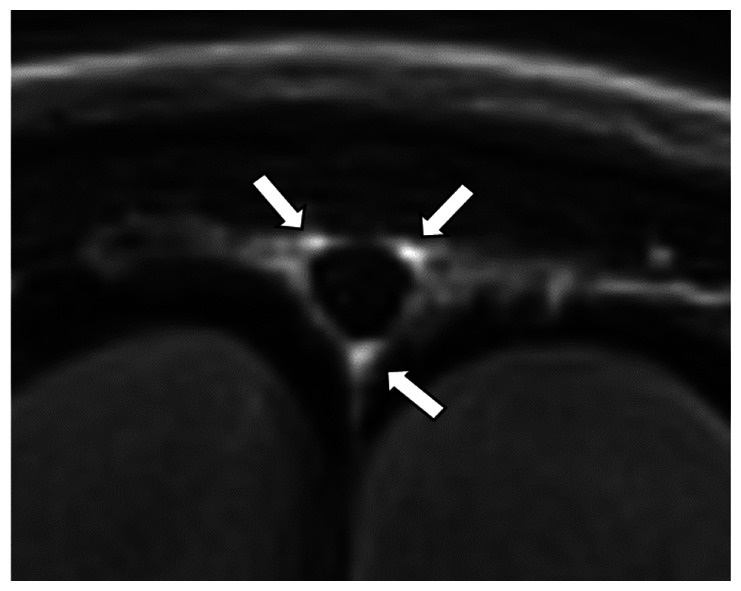
Pre- and post-contrast SI of meningeal lymphatics in cross section. Semi-quantitatively by placing 1 mm3 ROIs on 2 or 3 punctate hyperintensities. Qualitatively by visual scoring (0–4). |
|
| Posterior | Floor of lateral ventricles | Axial |
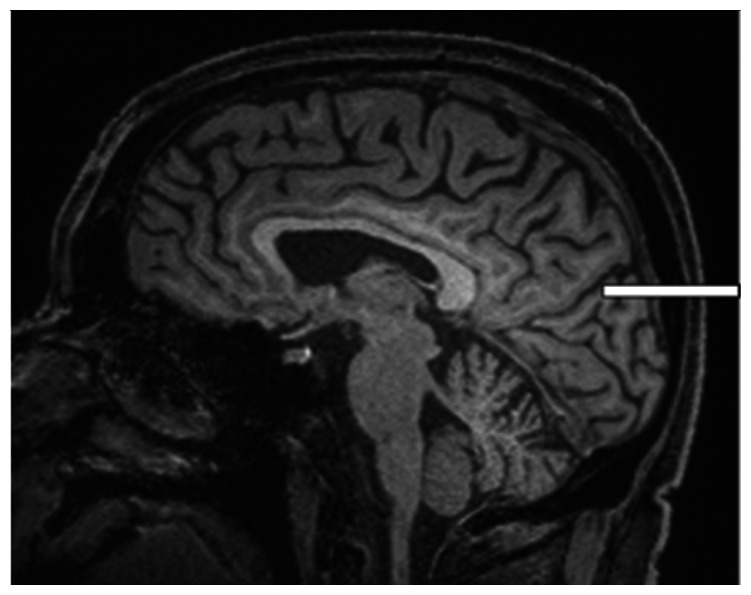
|
Pre- and post-contrast SI of meningeal lymphatics in cross section. Semi-quantitatively by placing 1 mm3 ROIs on 2 or 3 punctate hyperintensities. Qualitatively by visual scoring (0–4). |
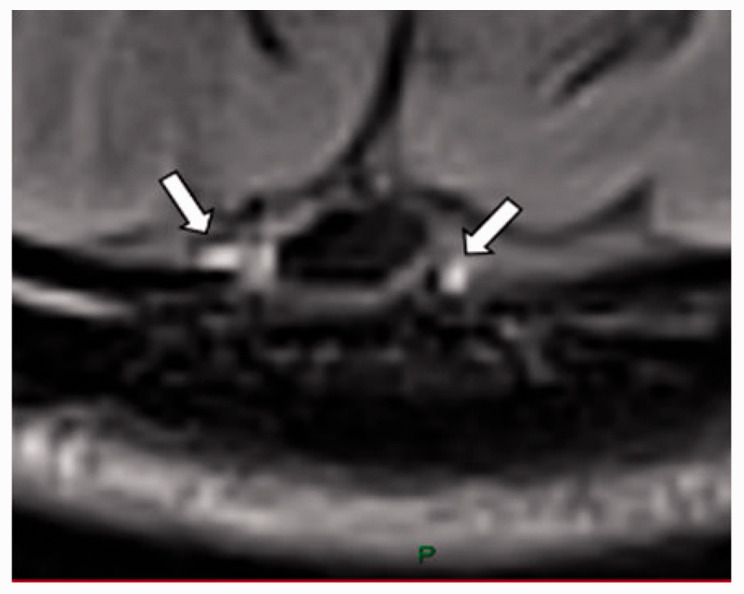
|
| Torcula | Confluence of the superior sagittal sinus and the straight sinus, anterior to the transverse sinus. | Coronal |
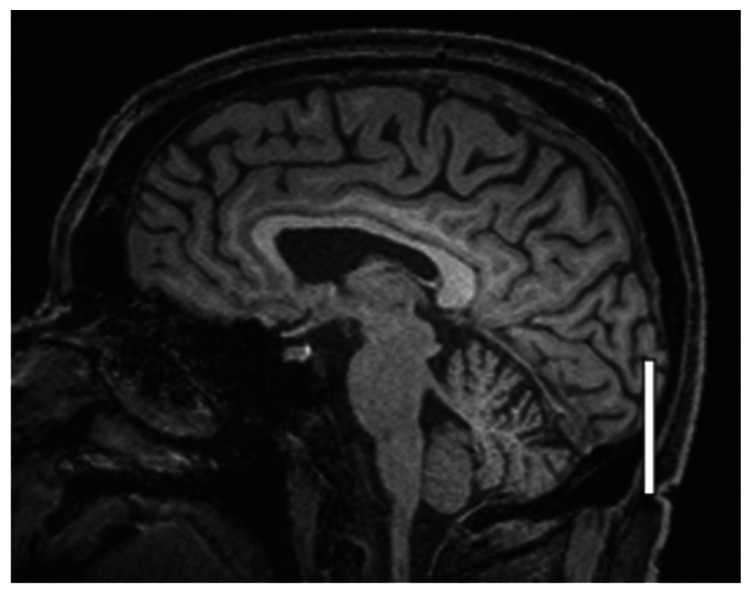
|
Pre- and post-contrast SI of meningeal lymphatics in cross section. Semi-quantitatively by placing 1 mm3 ROIs on 2 or 3 punctate hyperintensities. Qualitatively by visual scoring (0–4). |
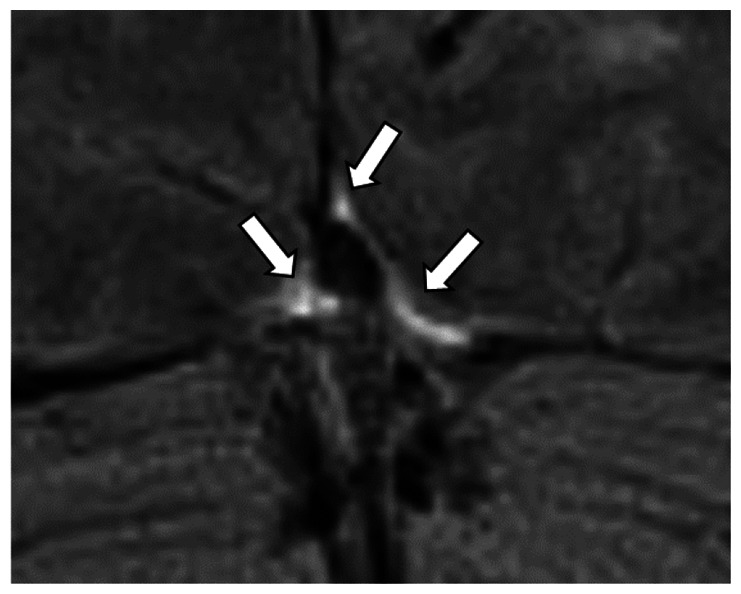
|
| Cribriform plate | Coronal |
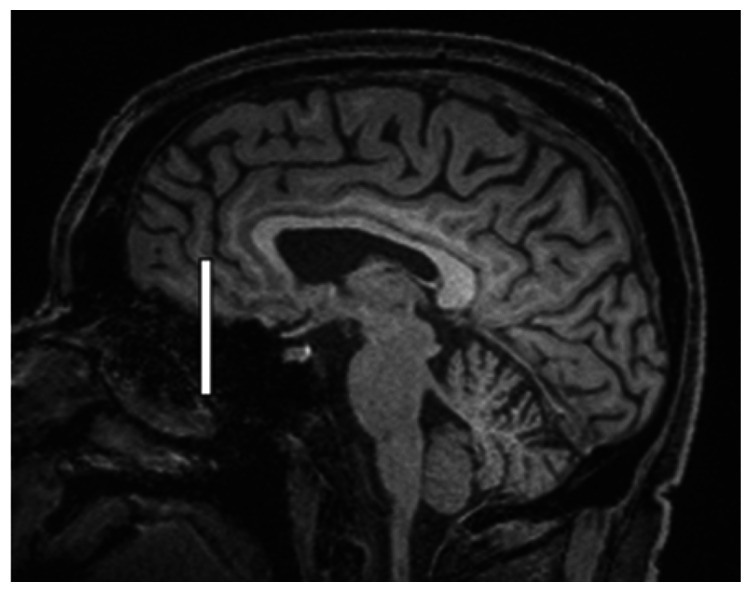
|
Pre- and post-contrast SI of meningeal lymphatics in cross section. Semi-quantitatively by placing 1 mm3 ROIs on 2 punctate hyperintensities. Qualitatively by visual scoring (0–4). |
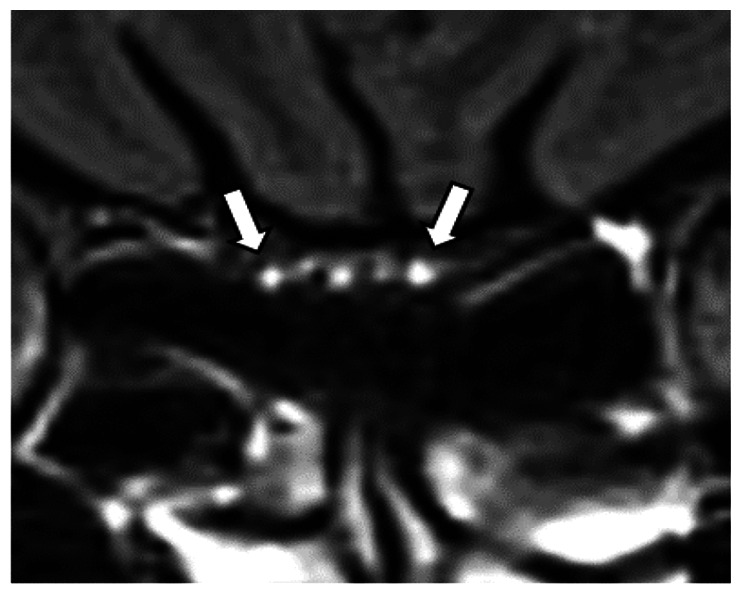
|
|
| Jugular foramina | Axial |
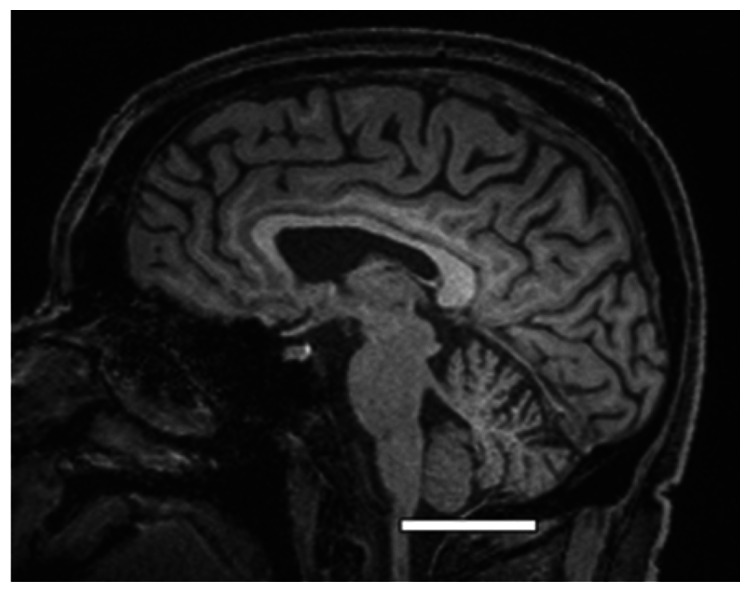
|
Pre- and post-contrast SI of the pars nervosa of the jugular foramen. Semi-quantitatively by placing 7 mm3 ROIs. Qualitatively by visual scoring (0–4). |
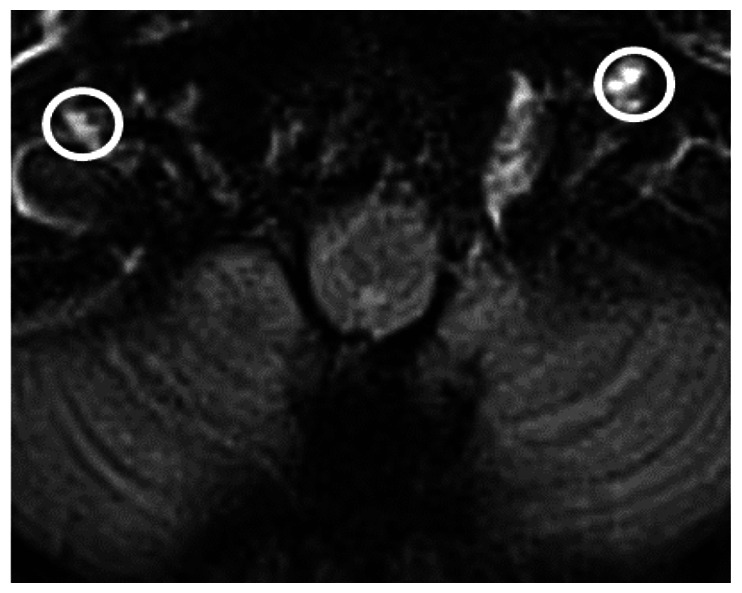
|
|
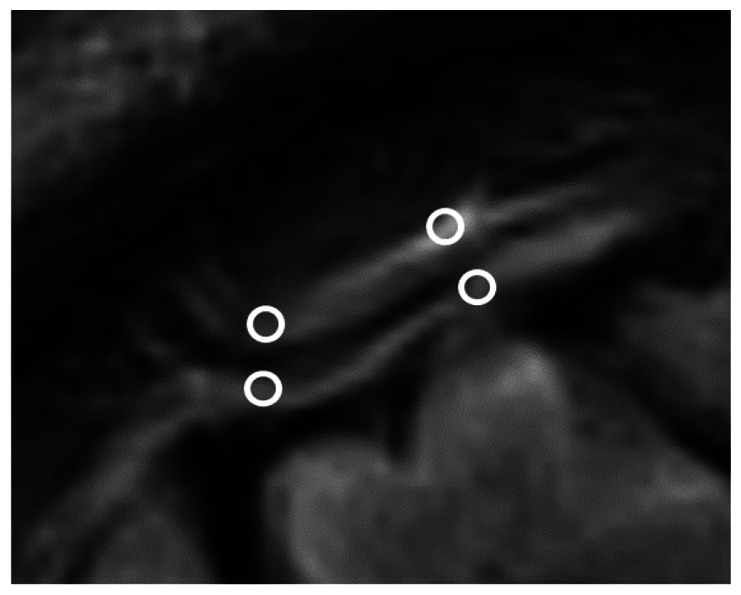
| Superficial cortical perivenous spaces | – | Coronal | – | Pre- and post-contrast SI of perivenous hyperintensities in longitudinal section. Semi-quantitatively by placing two pairs of 1 mm3 ROIs at either side of the vessel. Qualitatively by visual scoring (0–4). |
|
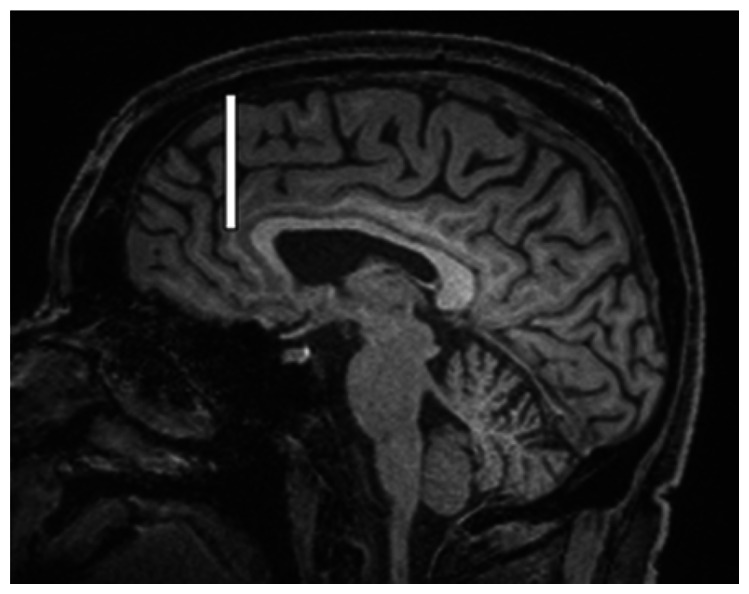
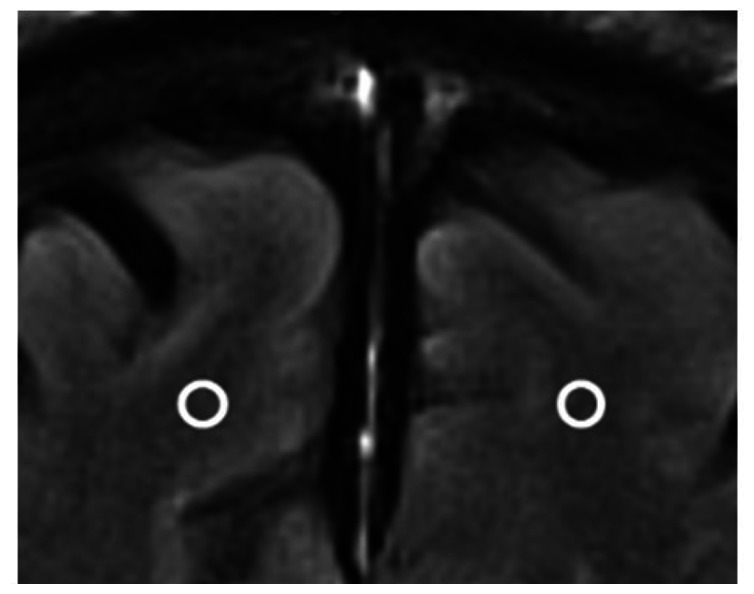
| ’Negative’ reference (NAWM) | Anterior temporal pole. Upper corona radiata. | Coronal |
|
Pre- and post-contrast SI. Semi-quantitatively by placing a 5 mm3 ROI at either side of the midline. |
|
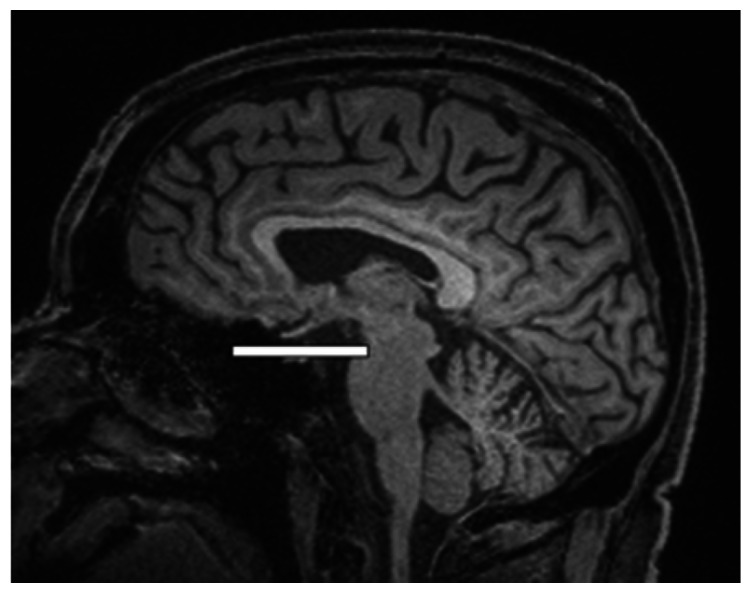
| ‘Positive’ reference (Pituitary stalk) | – | Axial |
|
Pre-and post-contrast SI. Semi-quantitatively by placing a 2 mm3 ROI. |
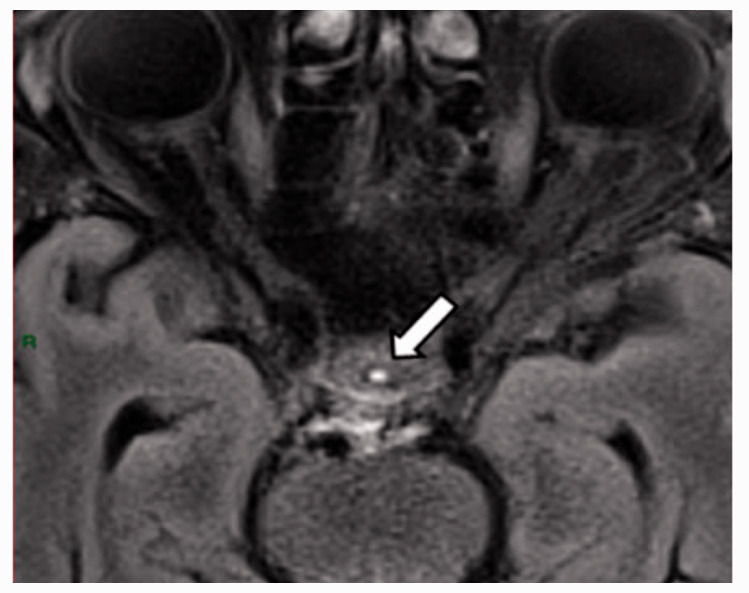
|
The white bar in the column ‘plane of measurement’ indicates location of scan slice, in the orientation indicated in the column ‘projection’ and shown in the column ‘example images’. In the ‘example images’ the arrows indicate the meningeal lymphatics seen as punctate, linear, or sheet hyperintensities on T2 FLAIR post-contrast that were measured by placing ROIs. For the jugular foramina, superficial cortical perivenous spaces, and normal appearing white matter, ROIs are indicated by circles.
FLAIR: fluid-attenuated inversion recovery; NAWM: normal appearing white matter; ROI: region of interests; SI: signal intensity.
