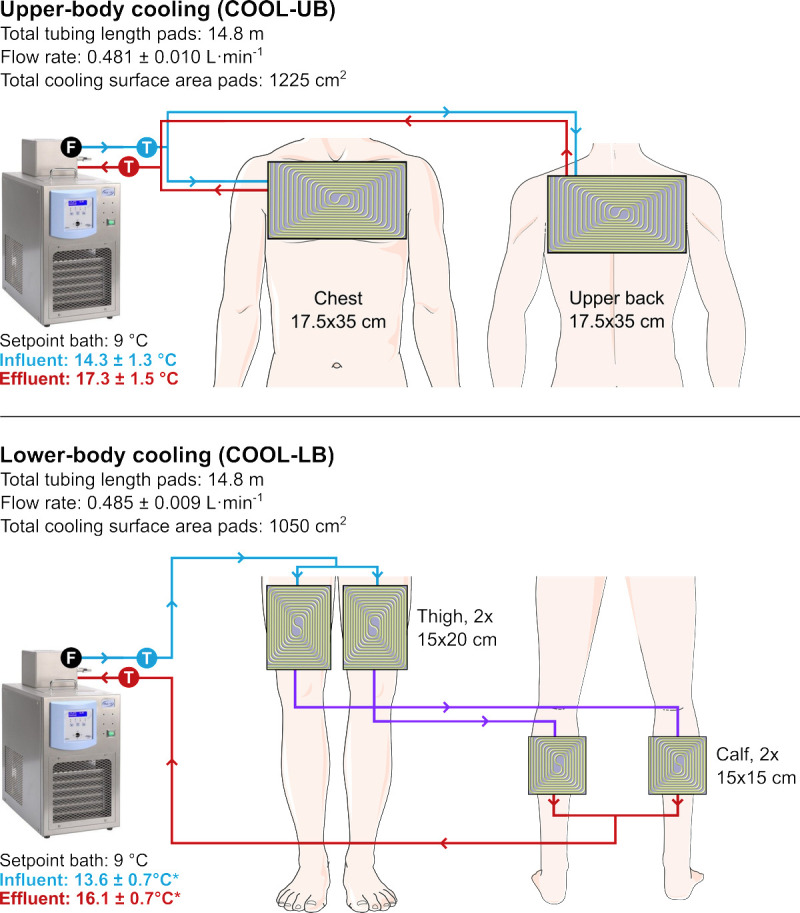
FIGURE 1.

Schematic overview of the cooling systems in COOL-UB and COOL-LB. Blue and red lines represent effluent and influent water to the pads, respectively. “F” and “T” represent the flow rate and temperature measurements of circulating water, respectively. *Influent and effluent water temperatures were lower in COOL-LB than in COOL-UB (P < 0.001).
