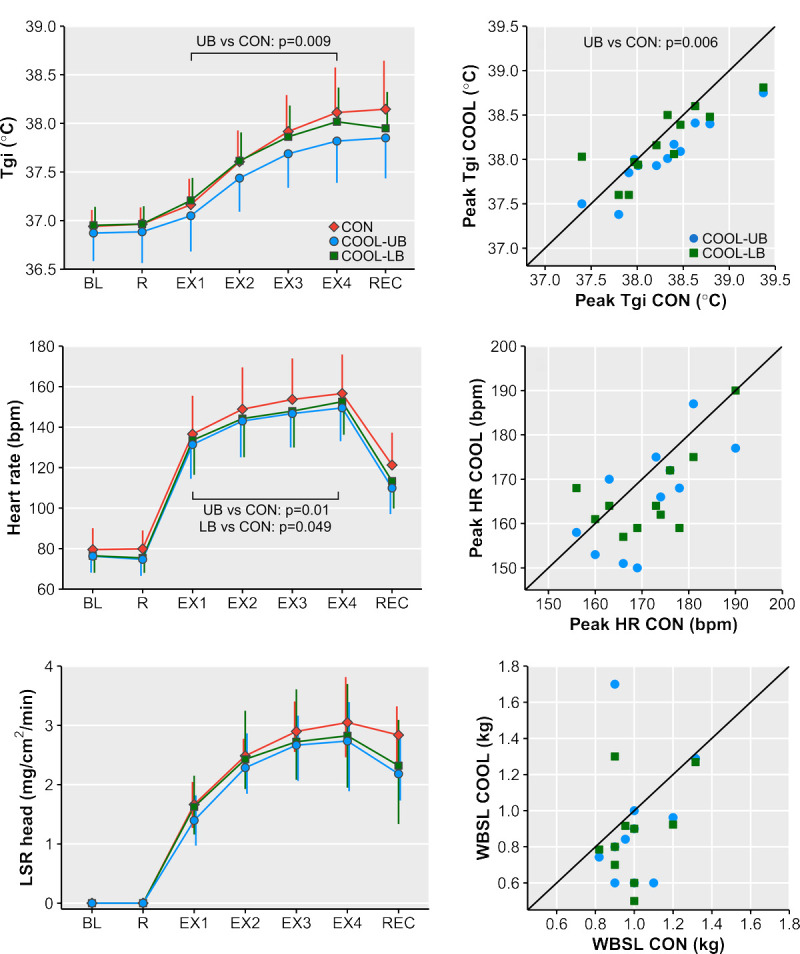
FIGURE 2.

Left: Tgi (A; Tgi; mean ± SD), heart rate (C; mean ± SD), and LSR on the forehead (E; LSR head; median (Q1–Q3)) over time in the control (CON), upper-body cooling (COOL-UB), and lower-body cooling (COOL-LB) conditions. Right: Scatterplots of individual data points with identity line for peak Tgi (B), peak heart rate (D), and whole-body sweat loss (F; WBSL), with values for CON on the x axis and values for both cooling (COOL) conditions on the y axis. When a data point falls below the identity line, the value in COOL is lower than in CON. Only P values <0.05 are displayed. BL, baseline; EX, 15-min exercise block; R, 15-min rest; REC, 15-min recovery.
