
FIGURE 5.
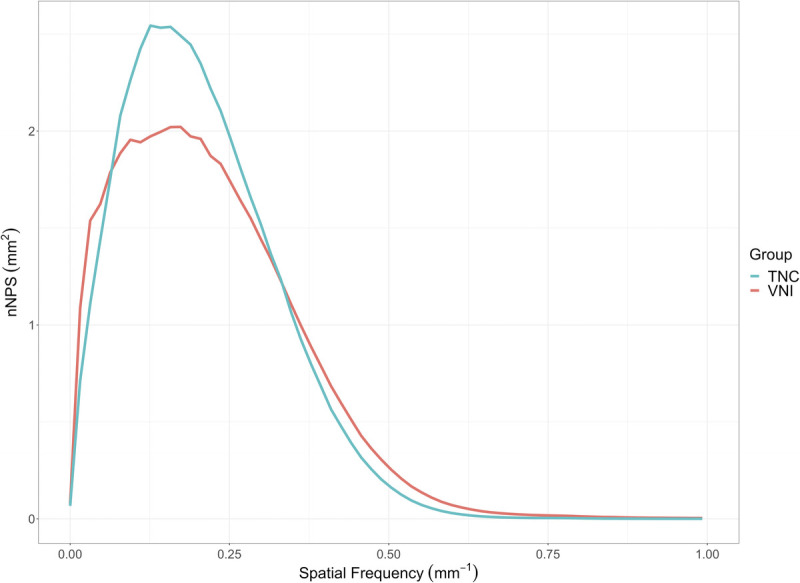
Normalized noise power spectrum demonstrated similar image noise texture between TNC and VNI images as indicated by comparable average and peak spatial frequencies. fav = 0.21 mm−1 and 0.22 mm−1 and fpeak 0.16 mm−1 and 0.16 mm−1 for TNC and VNI, respectively.