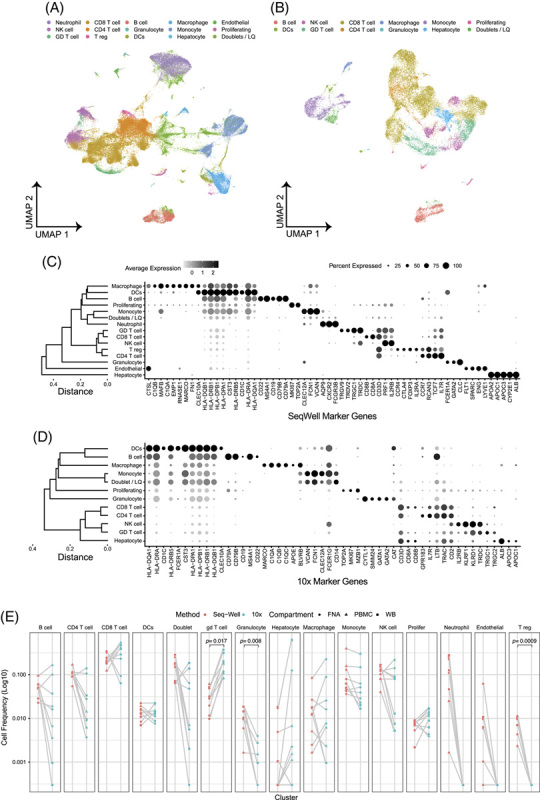
FIGURE 2.

10 × 3′v2 versus Seq-Well S3 comparison. UMAPs of all data from (A) Seq-Well and (B) ×10. Dot plot of cell type marker genes for (C) Seq-Well and (D) ×10. (E) Cell type frequencies compared across matched samples (gray lines) for Seq-Well S3 (red) and ×10 (blue). Paired t test was used to test for statistical significance. Samples from FNA, PBMC, and WB are circles, triangles, and squares, respectively, n = 4 patients run in parallel, and 8 samples account for blood and liver from each patient. Abbreviation: FNA, fine-needle aspirates.
