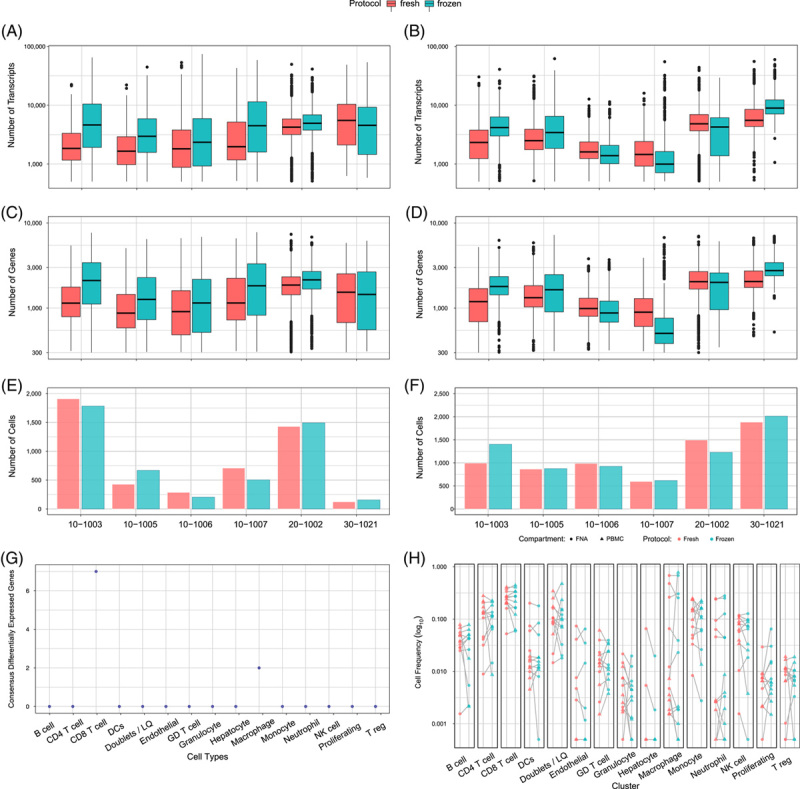
FIGURE 3.

Data comparison of freshly processed versus frozen arrays. (A) Number of transcripts/cells, (B) Number of genes/cells, and (C) number of cells captured in liver FNAs from 6 different patients. (D) number of transcripts/cells (E) number of genes/cell and (F) number of cells captured in peripheral blood from 6 different patients. Paired t test was used to test for statistical significance in panels (a–). (G) Number of differentially expressed genes in matched cell types between freshly processed and frozen arrays. Differential expression was performed on a participant and compartment basis. Genes were considered consensus differentially expressed if they were significant at adjusted p values < 0.05 and the absolute value of Cohen’s d > 0.2 across at least 6 of the 12 individual and compartment combinations. (H) Comparison of cell type capture across matched samples (gray lines) for fresh (pink) and frozen (blue) arrays. Samples from FNA and PBMC are circles and triangles, respectively. Paired t test was used to test for statistical significance (n = 6 patients, blood and liver). Abbreviation: PBMC, peripheral blood mononuclear cells.
