FIGURE 4.

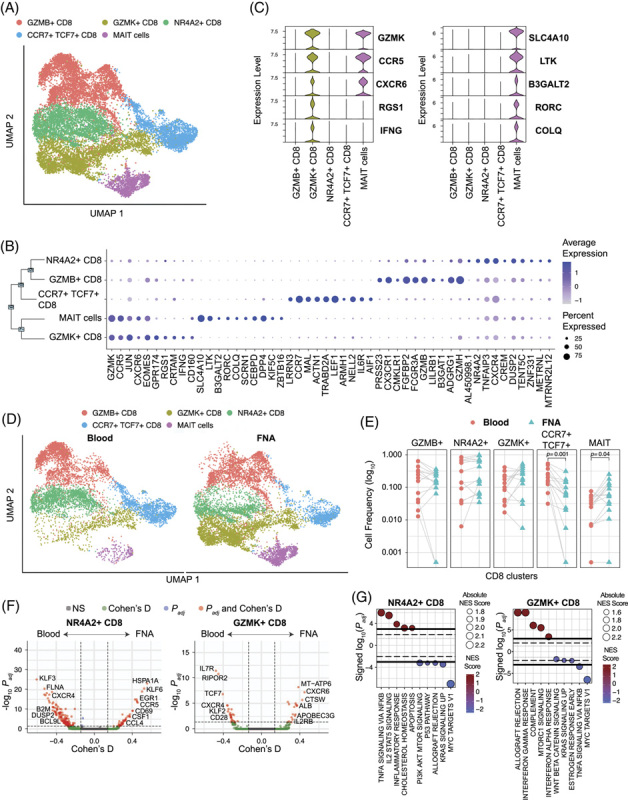
CD8 T cell composition in liver versus blood. (A) scRNA-seq UMAP for CD8 T cells colored by cluster IDs. (B) Dot plot showing the top 10 marker genes for each cluster ID. (C) Violin plot showing the top 5 marker genes for GZMK + CD8 and MAIT cells. Significance was determined using the Wilcoxon Rank sum test. (D) scRNA-seq UMAP colored by cluster and split based on tissue of origin, that is, liver and blood. (E) Comparison of cell frequencies between blood and liver within sample (connected through grey lines) for each CD8 cluster. Significance was determined using Wilcoxon Signed-Rank test with the Bonferroni correction (adjusted p-value < 0.05). (F) Volcano plots depicting differences in gene expression between blood and FNA in NR4A2 + and GZMK + CD8 T cells. The R-package MAST was used to obtain hurdle p values that were Bonferroni corrected for multiple hypothesis testing. Positive Cohen’s d value suggests higher expression in liver. Cohen’s d cutoff calculated as mean + ×2 SD of Cohen’s d values of all genes. (G) Hallmark gene sets enriched by NR4A2 + and GZMK + CD8 T cells. The normalized enrichment score was calculated based on a vector of gene-level signed statistic and false discovery rate was adjusted based on the Benjamini-Hochberg (BH) Correction. x-axis represents the signed log10 of adjusted p-value for the gene sets, and the positive value suggests enrichment in the liver. Abbreviation: MAIT, mucosal-associated invariant T.
