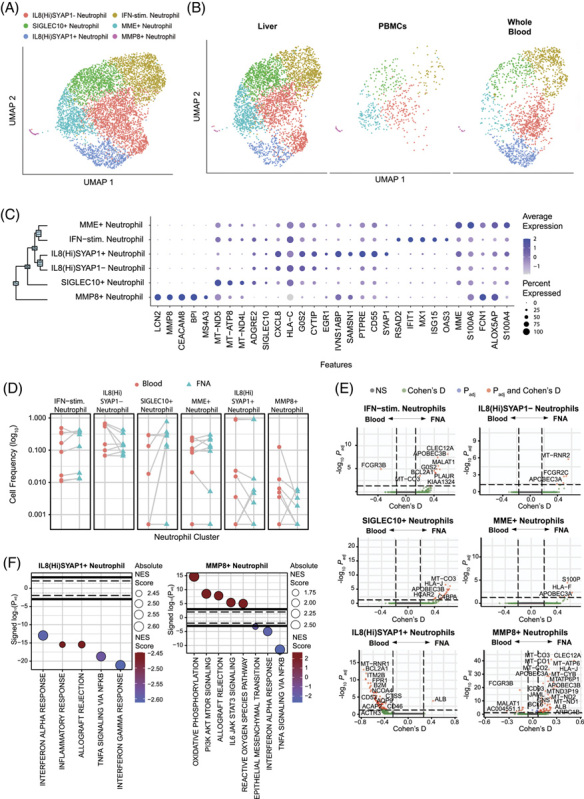
FIGURE 5.

Neutrophil identification. (A) scRNA-seq UMAP for neutrophils colored by cluster IDs. (B) UMAP dimensionality reduction of neutrophils by compartment. (C) Dot plot showing top 5 marker genes for each cluster determined using the Wilcoxon Rank sum test with the Bonferroni correction (adjusted p-value < 0.05). (D) Differential frequency of neutrophil clusters between compartments. Participants with 0 cells within a cell population were excluded. Significant differences between compartments were assessed using the Wilcoxon Signed-Rank test with the Bonferroni correction (adjusted p-value < 0.05). (E) Volcano plots depicting differences in gene expression between compartments within each cluster. The R-package MAST was used to obtain hurdle p values that were Bonferroni corrected for multiple hypothesis testing. Positive Cohen’s d value suggests higher expression in the liver. (F) Hallmark gene sets enriched for clusters with differentially expressed genes between compartments. The normalized enrichment score was calculated based on a vector of gene-level signed statistic and the false discovery rate was adjusted based on the Benjamini-Hochberg (BH) correction. x-axis represents signed log10 of adjusted p-value for the gene sets, and positive value suggests enrichment in liver.
