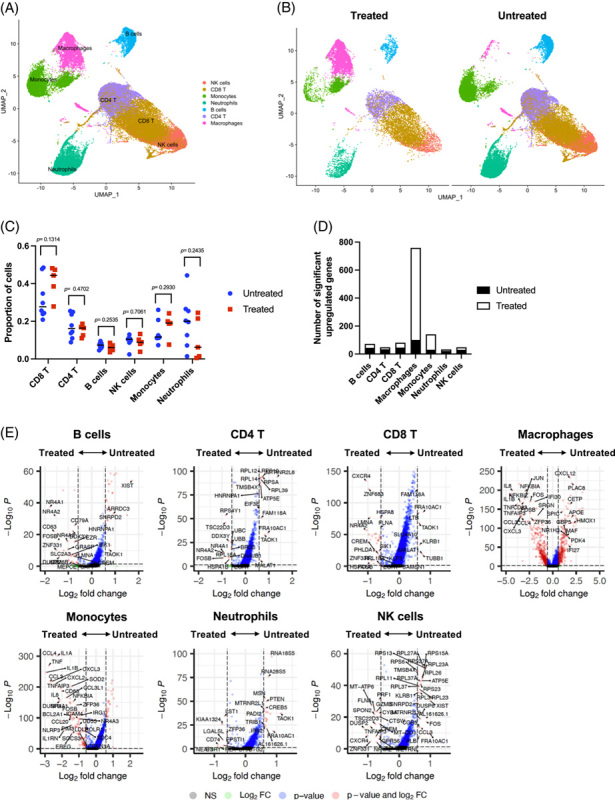
FIGURE 7.

Myeloid cells are the most sensitive to treatment in patients with CHB. (A) scRNA-seq UMAP of cells from treated and untreated patients with CHB. (B) UMAP dimensionality reduction of intrahepatic cells by treatment. (C) Comparison of cell proportions between treatment. Dots represent individual donors; bars indicate mean values. The unpaired t test was used to test for statistical significance. (D) Number of differentially upregulated genes in each intrahepatic cluster between treated and untreated patients with CHB. (E) Volcano plots showing genes that are differentially expressed between treated and untreated patients with CHB. Significance was determined using the Wilcoxon rank sum test with Bonferroni correction (adjusted p-value < 0.05). Thresholds: p < 0.05 and log2 fold change ≥ 1.5. Genes upregulated in untreated patients are shown to the right-hand side of each plot. Genes upregulated in treated patients are shown on the left-hand side of each plot. Abbreviation: scRNA-seq, single cell RNA sequencing.
