
Figure-3. Overall and subpopulation estimates of AFAHRF and AFAHRF-UL.
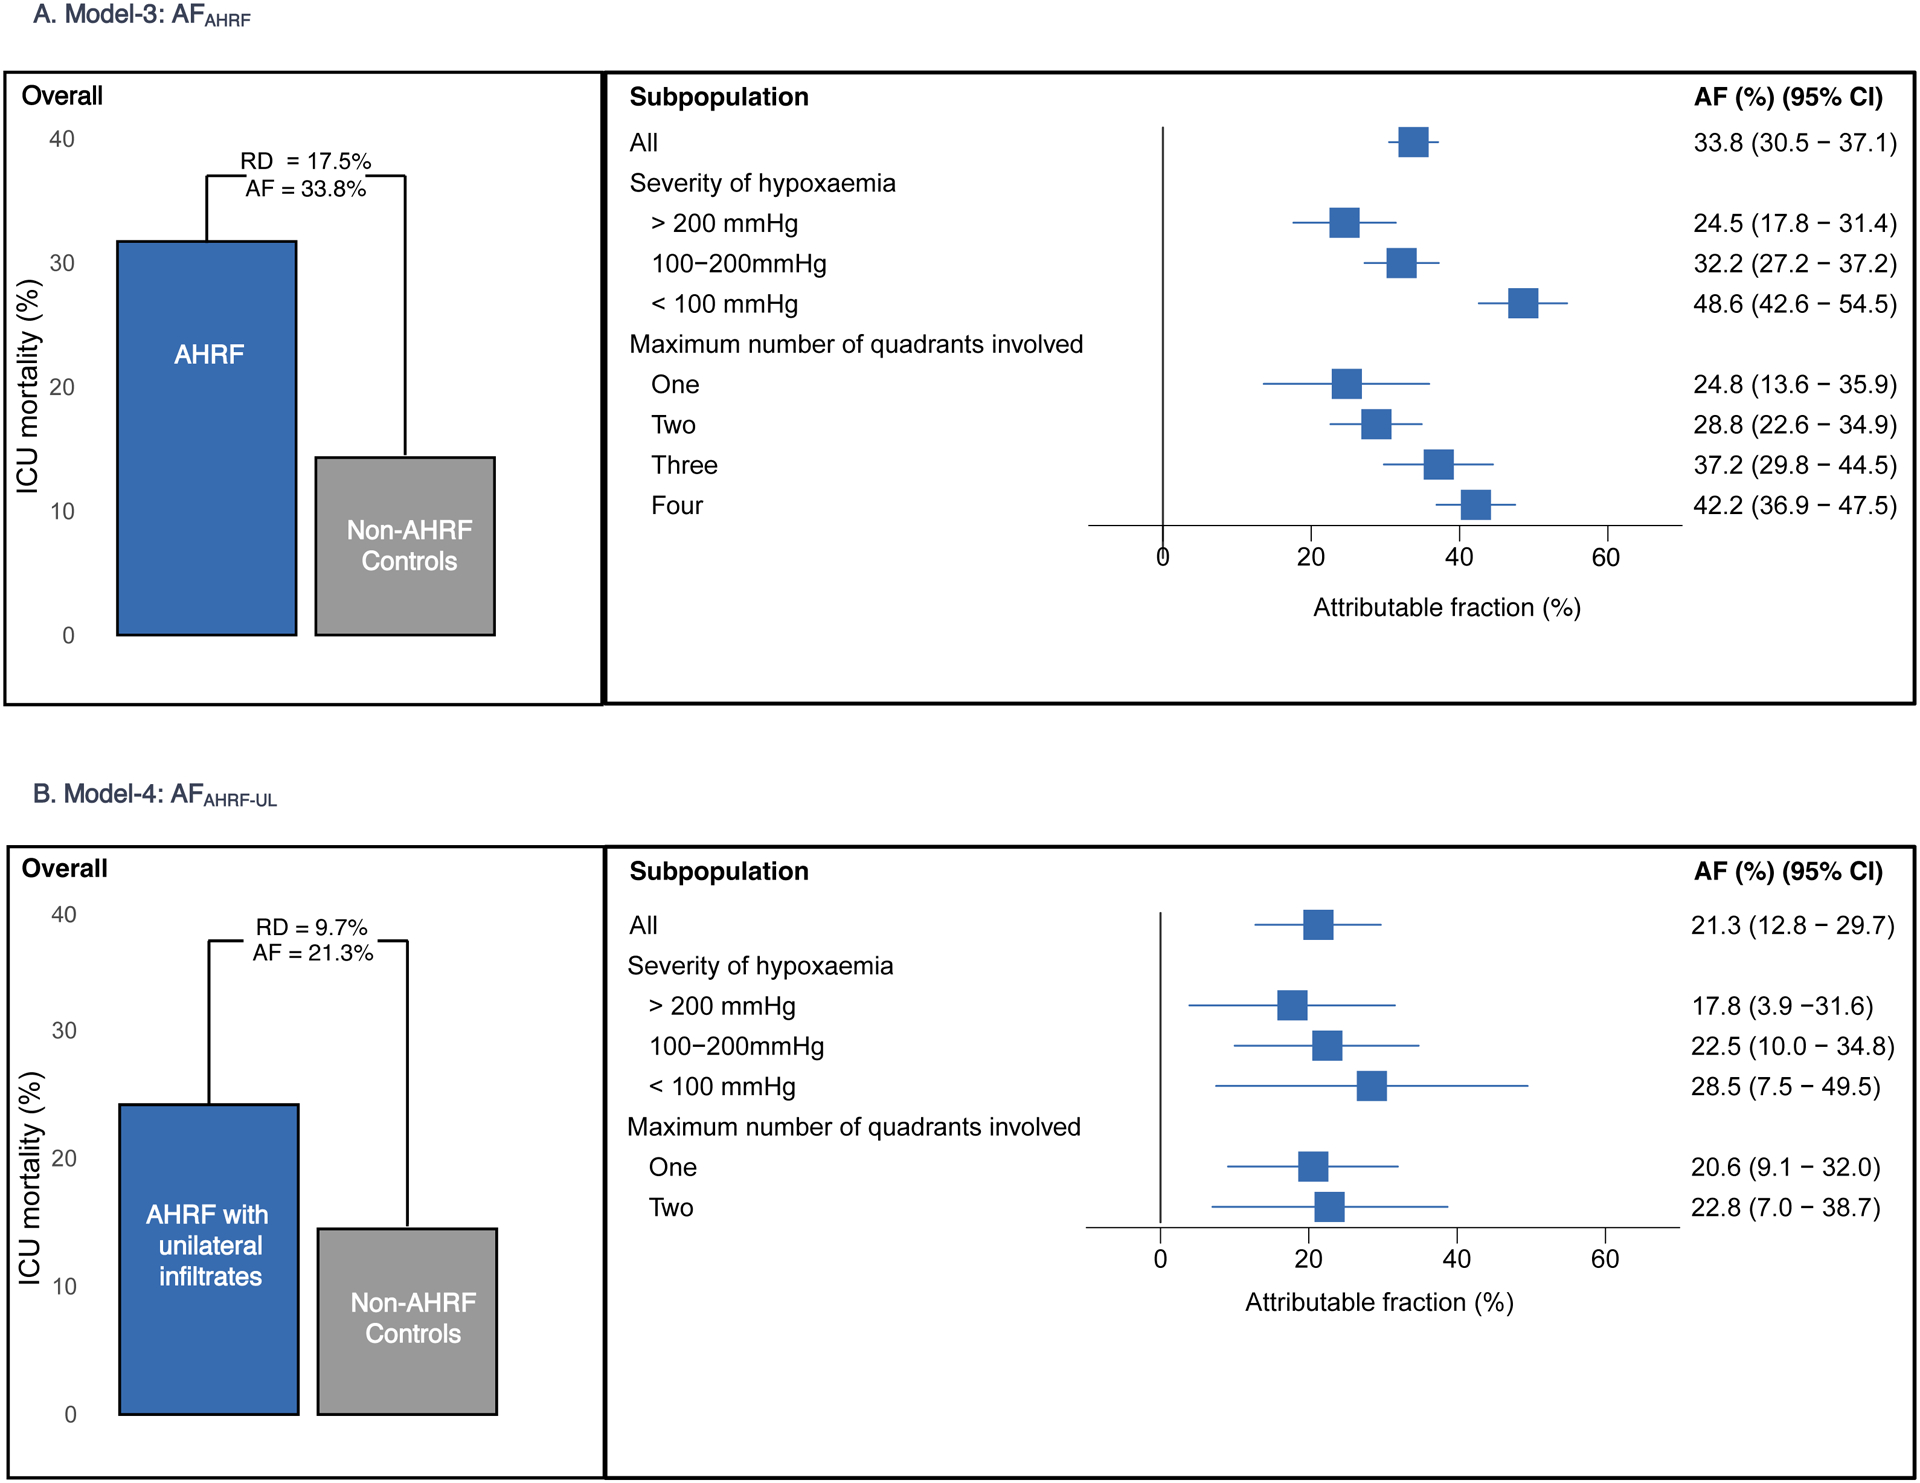
Figure-3a. Bar graphs show the mortality difference between AHRF population compared with propensity matched non-AHRF controls. AFAHRF estimates stratified by severity of hypoxaemia and maximum number of quadrants involved in the first 48 hours are shown in the forest plot.
Figure-3b. Bar graphs show the mortality difference between AHRF-UL population compared with propensity matched non-AHRF controls. AFAHRF-UL estimates stratified by severity of hypoxemia and maximum number of quadrants involved in the first 48 hours are shown in the forest plot.
AF: attributable fraction; AHRF: acute hypoxemic respiratory failure; AHRF-UL: acute hypoxemic respiratory failure with unilateral infiltrates only; CI: confidence interval; RD: risk difference.