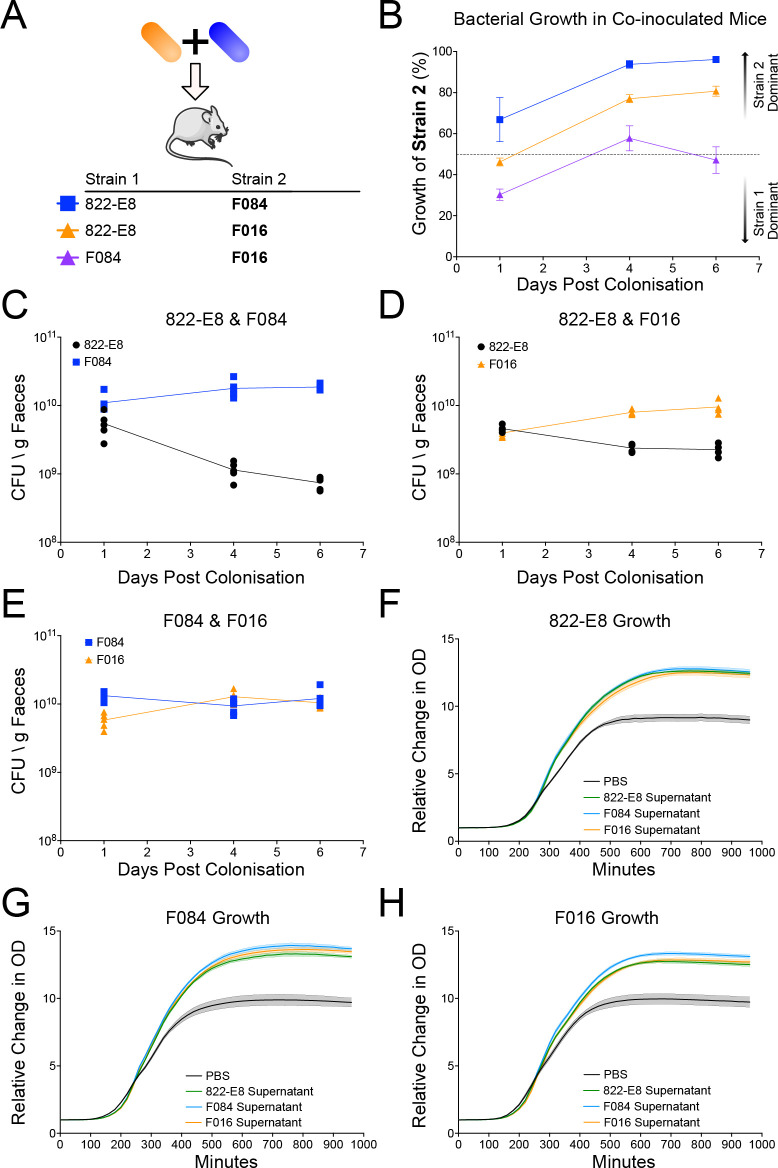
Fig 1. Co-colonisation of mice with 2 strains of E. coli and supernatant growth curves.
(A) Schematic of mouse colonisation set up, 2 strains of E. coli are mixed immediately prior to gavage. (B) Growth of E. coli in co-colonised mice measured by strain specific qPCR. Growth of the strain 2 listed in the schematic is plotted as a percentage of total growth against days post gavage (n = 5, 822-E8 and F084, growth of F084 in blue; n = 4, 822-E8 and F016, growth of F016 in orange, n = 5 F084 and F016, growth of F016 in purple). Dotted line at 50% indicating equivalent growth of both strains, values higher than 50% indicate higher growth of strain 2, while values less than 50% indicate lower growth of strain 2. (C–E) CFU per gram of faeces as measured by qPCR for mice colonised simultaneously by 822-E8 (black) and F084 (blue) (C), 822-E8 (black) and F016 (orange) (D), or F084 (blue) and F016 (orange) (E). (F–H) Growth of 822-E8 (F), F084 (G), or F016 (H) strain in 50% LB + 50% PBS (black), 822-E8 supernatant (green), F084 supernatant (blue), or F016 supernatant (orange), (n = 6). Parts of the figure were drawn by using pictures from Servier Medical Art. Servier Medical Art by Servier is licensed under a Creative Commons Attribution 3.0 Unported License (https://creativecommons.org/licenses/by/3.0/). Raw data used to produce figures available in S1 and S2 Data.

