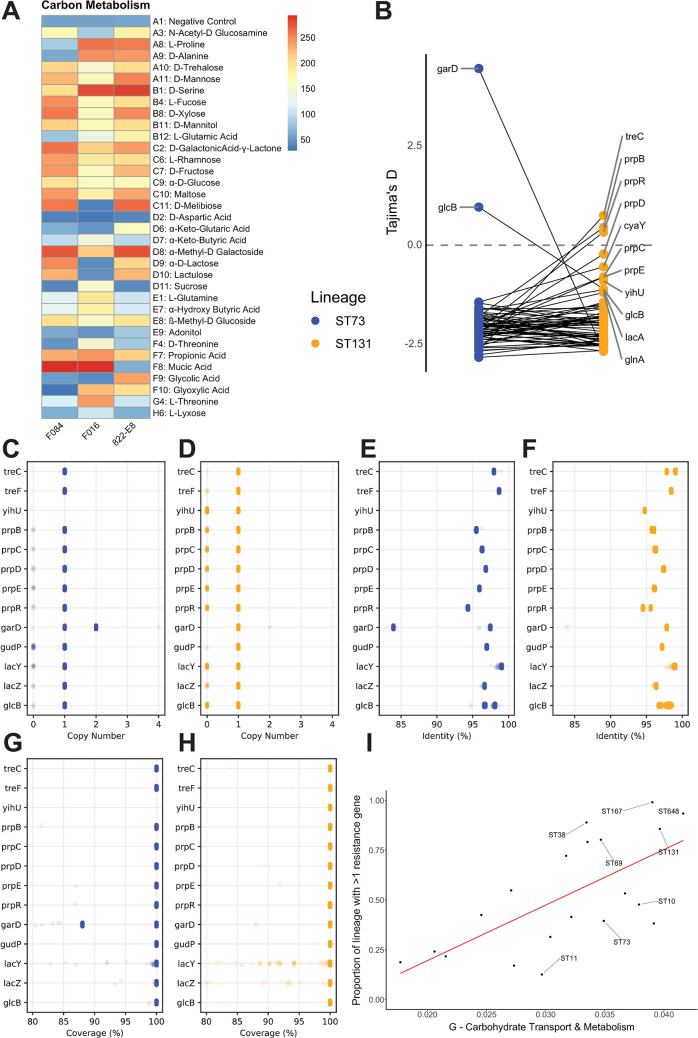
Fig 4.
(A) Biolog phenotypic microarray analysis of mouse colonising strains. (B) Tajima’s D measurements of genes involved in metabolism of differentially utilised metabolites. Genes which display a different value between ST73 (blue) and ST131 (orange) are labelled. (C–H) Genes involved in utilisation of metabolites that show differential patterns between ST73 and ST131 lineages. Number of gene copies per genome in ST73 I and ST131 (D). Percentage identity of K12 reference allele in ST73 (E) and ST131 (F). Percentage coverage of reference allele in ST73 (G) and ST131 (H). (I) The proportion of the accessory pangenome annotated with G COG category (carbohydrate transport and metabolism) against the proportion of each lineage with more than 2 resistance genes. Red line indicates linear regression line (R-squared of 0.4518, P-value of 0.0007). Raw data used to produce panel A available in S5 Data. Select metabolic reference gene sequences used to produce panels B–H available at 10.6084/m9.figshare.c.6147189. Genome assemblies and bioinformatics pipeline used to produce panel I are detailed in the Methods section.

